






Anomify
Anomify makes AI-based content detection more efficient and simpler.
Tags:AI content detectionWhat is Anomify?
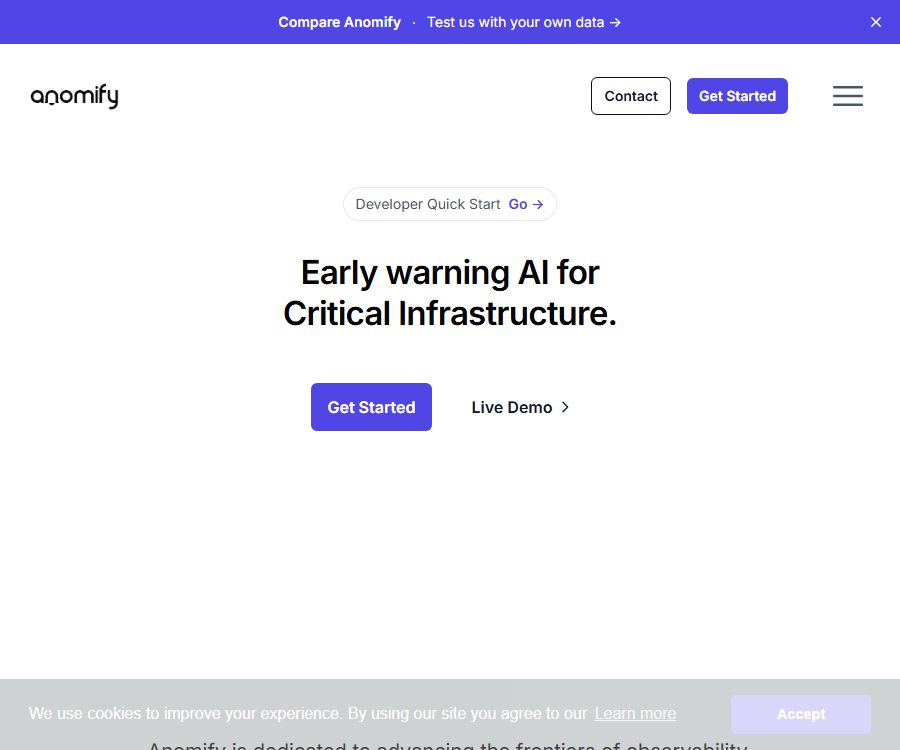
Anomify is a platform for real-time event detection and anomaly monitoring of time-series data, typically used as a complement to existing observability systems. It learns the normal behavior of various metrics over time, and detects anomalies when significant changes occur in those trends, sending alerts accordingly.
The platform is not only useful for server monitoring; it can also be used to analyze payment failures, e-commerce performance metrics, the temperature of energy-related equipment, and other data that is generated at regular intervals. It helps to reduce false alarms caused by static thresholds, and by identifying relevant events, it enables teams to shorten the time needed to locate faults.
Main functions of Anomify
Real-time anomaly detection
Once the metrics are uploaded to the platform, Anomify begins analyzing them automatically, continuously identifying any abnormal changes on a minute-by-minute basis. According to the official guidelines, at least 100 data points are required for analysis; a stable and regular sampling interval facilitates better judgment by the algorithm.
Three-stage analysis pipeline
In the first phase, rapid statistical methods are used to identify suspicious changes; in the second phase, logic, pattern recognition, and correlation analysis are employed to filter out noise; in the third phase, supervised learning models are developed based on team feedback.
This process first deals with unknown anomalies, and then gradually improves the system’s ability to make contextual judgments. Users can mark false alarms as legitimate behavior, thereby enabling the system to issue fewer alerts in the future when similar patterns are detected.
Intelligent alerts
All anomalies are recorded, but notifications are sent only for those metrics that match the configured alerts. Alerts can be sent via Slack, Webhook, or email, and it is possible to set the frequency at which alerts are issued for ongoing anomalies.
Root cause analysis and related events
The platform combines anomalies that occur around the same time or are related to each other, thereby providing context for troubleshooting. It cannot replace engineers in identifying the root cause of a problem, but it can help narrow down the range of metrics that need to be checked.
Multiple ways to integrate indicators
Anomify supports HTTP API, Telegraf, Prometheus Remote Write, VictoriaMetrics, and Graphite. Experimental integrations with OpenTelemetry and Jaeger enable the conversion of call tracking data into metrics such as method execution time and number of calls.
APIs and automation
The HTTP ingestion interface allows for the batch submission of time-series metrics, and authentication is carried out using API keys. The official documentation also states that all methods available in the dashboard can be invoked through program interfaces, which facilitates integration into existing operations workflows.
Flexible deployment
The official website lists options for cloud-native, on-premises, and hybrid deployment, allowing for customization based on data location, compliance requirements, and network needs. The specific architecture and scope of services need to be confirmed with the Anomify team.
Anomify Integration Tutorial
- Register for a trial or contact the team to specify the systems, business metrics, and sampling frequency that need to be monitored.
- On the dashboard, you can obtain the dedicated ingestion host, API key, and organization identifier.
- Choose HTTP API, Prometheus, Telegraf, Graphite, or another connection method.
- First, use test headers to verify the handling of metric names, timestamps, and tags, without proceeding to formal analysis.
- Remove the test header and continue to send metrics in chronological order.
- Wait for at least 100 data points and accumulate a several-day baseline before setting up official alerts.
- Priority should be given to setting up alerts for key metrics, with options to send notifications via Slack, Webhook, or email.
- The team continuously identifies expected behaviors and false positives, enabling the supervision model to adapt gradually to the business cycle.
Key limitations of HTTP API
- The metrics must be submitted in chronological order, using valid timestamps that are not later than the current time.
- The authorities recommend that no more than 500 indicators be requested per request, with a maximum request size of 1,024 KB.
- A 204 status code is returned upon successful ingestion; a 207 status code may be returned when the quota limit is exceeded, resulting in the rejection of additional metrics.
- A 413 error is returned if the request body is too large; it should not be sent again as is.
- The formal analysis begins once 100 data points have been collected in total.
Which teams are suitable?
- SRE and operations teams: Detect abnormal changes in infrastructure, service, and application metrics.
- E-commerce team: Monitors payment failures, order conversions, and traffic volume.
- Energy and IoT team: Identifies abnormalities in temperature, pressure, and device status.
- Security and Critical Infrastructure Team: Establishing continuous early warning for incidents.
- Platform engineering team: Add machine learning-based detection alongside Prometheus or OpenTelemetry frameworks.
Product advantages
- There is no need to predefine fixed thresholds for each unknown issue.
- User feedback can be used to train expected patterns, which is suitable for indicators with seasonal and periodic characteristics.
- Relevant events and context help narrow down the scope of root cause investigation.
- It supports common timing monitoring components, APIs, and various alerting channels.
- It supports cloud, on-premises, or hybrid deployment, making it suitable for enterprise environments.
Performance and data specifications
The official benchmark page shows a reduction in false positives of over 90%, an accuracy rate of 99.01% for the monitoring model, and an end-to-end alert latency of less than one minute. These are the results of official tests and scenarios; they do not guarantee that every customer’s environment will achieve the same levels.
Anomify is not a complete repository of long-term raw metrics. The platform preprocesses and stores the data intended for analysis on a minute-by-minute basis; the original values are discarded as a result, so the displayed figures may not exactly match those from the original monitoring system, though the trends should remain consistent.
- The processed data from sources such as Prometheus, InfluxDB, and VictoriaMetrics is retained for approximately 30 days.
- Graphite and other sources may remain intact for up to about 2 years.
- The training segments used for pattern matching are retained for a long time.
- The specific retention period is determined by the source of the data, its deployment method, and the customer agreement, and should be established during the procurement phase.
Usage restrictions and precautions
- Anomify is used to identify suspicious events, but it does not guarantee the detection of all anomalies; customers still need to verify the alerts and consult the original data sources.
- New systems integrated into the framework require sufficient data to establish a baseline; it is not appropriate to set all metrics as official alarms on the first day.
- Tags with high base values increase the scale of the metrics; it is necessary to discard unnecessary tags actively when integrating with Prometheus or OpenTelemetry.
- The component versions supported by the experimental OpenTelemetry and Jaeger documentation are older; it is necessary to verify the current compatibility range with the official sources before deploying in a production environment.
- The platform handles customer metrics and account information; in sensitive industries, it is necessary to verify data storage locations, encryption methods, access controls, and retention policies.
- Alarms are merely a starting point for investigation; they cannot replace the process of restoring service, human judgment, or business decisions.
Anomify prices
As of August 26, 2026, the official website does not disclose the amount of fixed packages nor provides a standard price list for direct comparison. The site offers a free trial option as well as the possibility to schedule discussions; the details regarding the scope of services, duration, quota limits, deployment methods, and prices are determined through agreement between the two parties.
- Trial method: The official website provides a “Try for Free” option.
- Enterprise procurement: Product demonstrations can be scheduled, and discussions can take place regarding scale requirements, alerting options, and deployment needs.
- Pricing basis: It is expected to be related to the number of indicators, the volume of data, the deployment method, as well as the duration of support and services.
- Contract reminder: The official terms specifying the exact prices are outlined in a separately signed agreement.
Therefore, the monthly fee should not be estimated based on third-party catalogs. The procurement team should request a written quote, and at the same time clarify the procedures for handling excess usage, data retention, service levels, deployment locations, and technical support.
The relationship between open source and products
Anomify’s commercial platform relies on proprietary algorithms developed by the company; it is not open source as a whole. The company states that its technology builds upon some of the concepts and modular detection mechanisms of the open-source EarthGecko Skyline, but it also incorporates supervised learning, correlation analysis, root cause analysis, and proprietary models.
Therefore, the open-source nature of Skyline does not mean that the Anomify platform is also open-source; it cannot be used as a basis to conclude that one can deploy a complete Anomify service on their own. If local deployment is required, it is necessary to purchase an official enterprise solution or negotiate one.
Frequently Asked Questions
What data can Anomify monitor?
It primarily analyzes time-series metrics generated at fixed intervals, and can be applied in scenarios such as IT infrastructure, applications, payments, e-commerce, energy, and the Internet of Things.
How does Anomify reduce false positives?
The platform utilizes statistical detection, context filtering, anomaly correlation, and supervised learning. Once the team marks a certain abnormal behavior as normal, the system establishes a pattern and filters out similar changes in the future.
Which alert channels are supported?
The official documentation lists Slack, Webhooks, and email as available options. Other channels can be integrated through Webhooks, and those with custom requirements should consult the officials.
Does Anomify provide an API?
Available. The HTTP API allows for the submission of metrics, and official program interfaces are also provided that cover dashboard functions; to use them, an account-specific host and an API key are required.
How much does Anomify cost?
The official website does not disclose a fixed amount; trials and scheduled consultations are available. The actual price is determined by the scale of the project, as well as the requirements regarding deployment and services, and it is specified in a separate customer agreement.
Is Anomify an open-source tool?
It is not an open-source product that has been officially recognized. It builds upon and expands on the technical foundation of the open-source Skyline, but the Anomify hosting platform, its proprietary models, and its enterprise capabilities constitute separate commercial products.
Tools similar to Anomify





 Guigong Network Security Registration No. 45132202000164