






Laminar
Laminar: an intelligent tool focused on improving AI efficiency.
Tags:AI improves efficiencyWhat is Laminar?
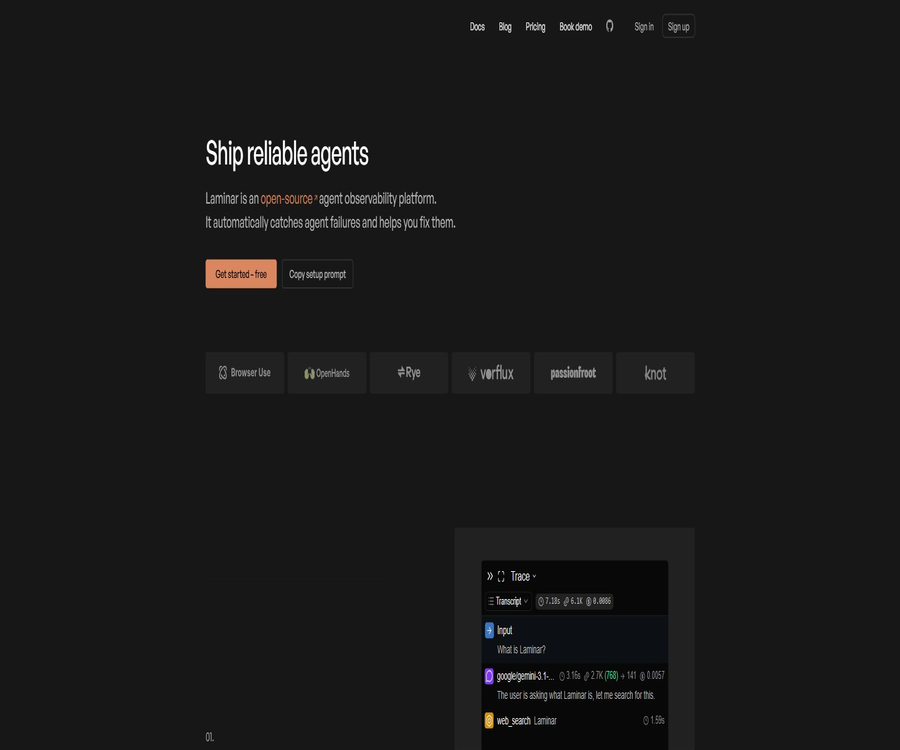
Laminar is an open-source platform for monitoring, debugging, and evaluating AI agents and large language model applications; it was developed by the lmnr.ai team and selected for Y Combinator S24. It records model calls, tool usage, control flows, and sub-agent activities, converting operational data into information that can be searched, queried, and evaluated.
Users can either use the hosted Laminar Cloud or deploy a full open-source stack. The product relies on OpenTelemetry for tracking, and it offers a more readable conversational tracking view tailored for long-running, multi-step, and parallel workflows.
What problems does it mainly solve?
- Check which models and tools the agent actually calls at each step.
- Costs of incorrect positioning, repeated calls, loops, and exceptions.
- Automatically discover behavior patterns from mass production tracking.
- Run regression testing before making changes to prompts, models, or code.
- Convert real failure cases into a evaluation dataset.
- Analyze operational data using SQL, full-text search, and dashboards.
- Store sensitive tracking data in the cloud or on your own infrastructure.
AI agent tracking
Tracing records the model inputs and outputs, tool parameters and results, function calls, errors, delays, Tokens, and costs during the operation of a proxy. Laminar presents complex proxy trajectories in the form of conversational transcripts, and folds sub-proxies into expandable cards to reduce the complexity associated with viewing the Span tree.
Automatic and manual event tracking
| Tracking methods | Working method | Suitable scenarios |
|---|---|---|
| Automatic instrumentation | Capture supported frameworks and model clients after initializing the SDK | Quick access to existing proxy applications |
| Function wrapping | Wrap the function with observe and log the input and output. | Tracking business steps and tool functions |
| Manual Span | Explicitly create hierarchies and additional attributes. | Complex control flow and custom frameworks |
| OpenTelemetry import | Receive standard OTLP tracking data | There are already observable systems and cross-service agents available. |
Common integrations
- Clients for the OpenAI, Anthropic, and Gemini models.
- Vercel AI SDK and OpenAI Agents SDK.
- Claude Agent SDK and OpenHands SDK.
- LangChain, Mastra, and Pydantic AI.
- Browser Use, Stagehand, and Playwright browser proxies.
- LiteLLM and other OpenTelemetry-compatible services.
Real-time tracking and full-text search
The platform can display Spans in real time, even before the proxy task has finished, which is useful for monitoring long-running tasks, parallel sub-proxies, and browser operations. All tracking data supports full-text search, field filtering, and table views, allowing developers to quickly identify issues by examining error messages, tool parameters, or user-generated content.
Browser session replay
For browser proxies such as Browser Use, Stagehand, and Playwright, Laminar can link page operations to proxy tracking. Developers can see why the model chose a particular action, as well as review the browser state at the time of execution.
Signals production monitoring
Signals enables teams to describe in natural language the outcomes or failures that need to be monitored, such as whether a proxy calls a tool repeatedly, generates fake data after an interface failure, or if a user gives up on a task. The system reads the entire log rather than just the final result, and creates structured events when a match is found.
Composition of Signal
| Components | Function | Configuration example |
|---|---|---|
| Prompt | Describe the behavior to be detected or extracted. | Continuing to provide unfounded conclusions even after failed attempts to find the necessary tools. |
| Structured Schema | Define the fields that must be extracted from an event. | Failed tools, error messages, and impact on users |
| Trigger | Decide when to conduct analysis and tracking. | The root Span ends, or the specified Span ends. |
| Filters | Limit the scope of tracking that needs to be analyzed. | Minimum Token, Error Status, or Span Name |
| Severity | Mark the severity of the event | Critical, Warning, or Info |
Signals workflow
- The new tracking meets the trigger and filtering criteria.
- The system compresses long traces while retaining the models, tools, and main error paths.
- The Signals agent investigates compressed content based on natural language rules.
- Read the entire Span when necessary to verify the specific input and output.
- Convert the discoveries into structured events that conform to the Schema.
- The event is linked back to the original tracking and added to the search index.
- Similar events are automatically clustered to identify recurring patterns.
- Events that meet the criteria are alerted via Slack or email.
The difference between Signals and the ratings of ordinary LLMs
Ordinary scorers usually only examine the final output of the model, making it difficult to detect errors in the tools used earlier in the process, invalid sub-agents, or repeated calls. Signals, on the other hand, analyzes the entire execution sequence and can relate the final outcome to the results produced by the intermediate tools.
| Comparison items | Regular output scoring | Laminar Signals |
|---|---|---|
| Analysis scope | It is usually the final answer. | Complete model, tools, sub-agents, retry, and error tracking |
| Rule expression | Code or fixed scoring hints | Natural language detection rules combined with structured Schema |
| Results | One or more fractions | Structured events that can be queried, clustered, and for which alerts can be set |
| Operation mode | It is mostly used for offline samples. | It allows for real-time analysis of new tracking data, as well as the input of historical data. |
| Suitable questions | Answer quality and format | Logical failures, user friction, and wasted business resources and costs |
AI Agent Debugger
The debugger organizes the investigation of a problem into sessions, which include the original execution, replaying of the process, evaluation, commands, and development notes. After developers or programming agents modify the code, they can replay the recorded traces from a specified point; previous calls to the same model are retrieved from the cache.
Value of cached playback
Long-running agents may exhibit problems only after a long period of operation, and restarting everything from scratch would result in additional time consumption as well as extra costs related to the models. Prefix caching allows debugging to involve only the execution of the code from the point where changes were made, thereby accelerating the iteration of prompts, tools, and control processes.
- Run the proxy in debug mode and record a complete trace.
- Read the transcribed content to identify incorrect Spans or invalid behaviors.
- Modify hints, tools, code, or control flow.
- The recorded run was replayed from the boundary that needs to be verified.
- Compare old and new tracking, output, latency, and cost.
- Running evaluations on a fixed dataset proves that the fix was not accidental.
- Save the results and notes within the same debugging session.
- Publish the changes after passing through the regression access control.
Offline evaluation
The Laminar evaluation consists of data points, executors, evaluators, and group names. The system processes each input in parallel, records the execution and scoring spans, and plots the results of multiple runs within the same group as a trend chart, which facilitates the detection of any deviations or regressions after model upgrades.
| Evaluation section | Content | Function |
|---|---|---|
| Datapoints | Input, optional targets, and metadata | Define fixed test samples |
| Executor | Functions for running models, agents, or tools | Generate the actual output that requires scoring. |
| Evaluators | Functions that return numerical values or multi-dimensional scores | Measure accuracy, format, cost, or business conditions |
| Group | Names of multiple related runs linked together | Compare versions and observe changes in metrics. |
| Custom Rendering | Custom evaluation row view for data types | Improve the efficiency of manual review and difference comparison. |
Datasets and annotations
The team can create evaluation datasets from production tracking, SQL queries, APIs, or local data, and then add manual labels using a labeling queue. Including actual failures and edge cases in the dataset helps make regression tests more reflective of real-world issues.
- Convert query results into datasets in bulk.
- Create evaluation samples from a single exception trace.
- Save the target answer and metadata for the data points.
- Use a labeling queue to assign manual review tasks.
- Evaluate it within local scripts or continuous integration pipelines.
- Compare the score trends of multiple versions within the same group.
Playground
Playground allows for the replaying of tracked Spans, and it enables side-by-side comparison of results after replacing prompts, models, or inputs. It is suitable for quickly verifying a minor adjustment, but for official releases, evaluations using a larger number of samples should be used.
SQL, MCP, and dashboards
Laminar allows direct querying of traces, metrics, and Signal events through its built-in SQL editor; it also enables the creation of datasets or dashboards from the query results. CLI and MCP access enable programming agents to read observable data, perform analyses, and participate in debugging processes.
| Analysis entry point | Ability | Suitable for users |
|---|---|---|
| SQL Editor | Query tracking, Spans, metrics, and events | Data engineers and senior developers |
| Dashboards | Create charts using metrics and custom SQL. | Products, platforms, and operations teams |
| Full-text Search | Search for Span input/output and errors | Troubleshooting and customer support |
| CLI | Perform evaluations, manage data, and debug sessions | Developers and continuous integration processes |
| MCP | Allow the AI client to query and analyze Laminar data. | Research on Programming Agents and Automation |
Python and TypeScript SDKs
The official version provides Python and TypeScript clients, which can be used to initialize project keys, automate the management of supported models and frameworks, and wrap custom logic using decorators or functions. The Python package requires a specific version of Python; dependencies and the scope of automation features must be confirmed through the release notes prior to any upgrade.
- Create workspaces, projects, and project API keys.
- Install the Python or TypeScript SDK along with any required integrations.
- Initialize Laminar during the application startup phase.
- Add an observe wrapper to critical business functions.
- Run a local request and verify the tracking level and content.
- Add user, session, tag, and version metadata.
- Configure sampling and sensitive data processing before production.
- Create dashboards, Signals, and evaluation access controls.
Cloud pricing
The price information was verified on August 23, 2026; the actual amounts, taxes, exchange rates, and discounts may vary, and the final figures will be those displayed on the settlement page.
Laminar Cloud is billed based on the basic package, the amount of data tracked each month, the Signals analysis tokens, and the retention period. The Free plan does not allow for any excess data usage, while the Starter and Pro plans enable further billing in GBs beyond the included quota.
| Package or version | Price | Billing cycle | Core benefits or quota | Suitable for users |
|---|---|---|---|---|
| Free | $ | Monthly | 1GB of data, a 5-dollar Signals quota, 7 days of storage, 1 project and 1 seat – no excess allowed. | Individual developers and small prototypes |
| Starter | 30 dollars | Monthly | 3GB of data, 15 dollars worth of Signals credits, 30 days of storage, unlimited projects and seats; an additional charge of 2 dollars per GB for any excess usage. | Small teams and early production applications |
| Pro | 150 dollars | Monthly | 10GB of data, 50 dollars worth of Signals credits, 6 months of storage, unlimited projects and seats; an additional charge of 1.5 dollars per GB for any excess usage. | Multi-project production team |
| Enterprise | Custom quote | Contractual agreement | Custom quotas and reservations, on-premises deployment, dedicated support, and enterprise-level security features | Large-scale, compliant, and privately deployed organizations |
Signals billing
Signals does not charge on a one-to-one basis based on the original tokens used by the agent; instead, it charges according to the number of tokens consumed by the agent in carrying out the tracking. The system first compresses the tracking data – officials estimate that an average compression ratio of around 10% of the original token volume can be achieved, though the actual ratio varies depending on the output of the tools and the structure of the tracking data.
| Package | Includes Signals quota | Excess input price | Excess output price |
|---|---|---|---|
| Free | 5 dollars | Excess amounts are not supported. | Excess amounts are not supported. |
| Starter | 15 dollars | $ | $ |
| Pro | 50 dollars | $ | $ |
| Enterprise | Customization | Customization | Customization |
Points to consider when estimating costs
- There is no fixed conversion relationship between the tracking data in GB and the amount of proxy tokens.
- Saving the complete output of the tool will significantly increase the amount of data.
- The filtering range of Signals determines how many traces need to be analyzed.
- Backfilling historical tracking consumes a significant amount of Signals quota.
- A longer retention period may require a higher-tier plan or self-hosted storage.
- Model inference fees are not included in the Laminar subscription.
- With self-hosting, costs for databases, object storage, and operation and maintenance are still required.
Open source and licenses
The Laminar core repository, as well as the Python SDK and TypeScript SDK, are licensed under Apache Version 2; these can be viewed, modified, and deployed by users themselves. Commercial cloud services, enterprise images, license features, and dedicated support are subject to separate commercial terms.
| Project | Status | License or conditions | Primary uses |
|---|---|---|---|
| lmnr core repository | Public and continuously maintained | Apache Version 2 | Frontend, application services, query engine, and local deployment |
| Python SDK | Public | Apache Version 2 | Tracking and evaluation of Python applications |
| TypeScript SDK | Public | Apache Version 2 | Tracking of Node and TypeScript applications |
| Helm deployment repository | Public | Execute according to the warehouse documents | Deploying enterprise-scale components in Kubernetes |
| Corporate functions | Some require a license key. | Commercial license | Exclusive integration, support, and advanced security features |
| Laminar Cloud | Managed business services | Use by package | Cloud platform without the need for maintenance |
Self-hosted Docker
Lightweight self-hosting allows the use of Docker Compose to launch the frontend, application services, and any necessary data components; it is suitable for development and small-scale use. In a production environment, full orchestration files should be used, along with configurations for persistence, backups, network encryption, authentication, resource limits, and upgrade strategies.
Self-hosted Kubernetes
The official Helm solution is designed for AWS and Google Cloud clusters, and it supports PostgreSQL, ClickHouse, Redis, RabbitMQ, full-text search, and object storage. Public enterprise images can be downloaded, but certain integrations and features require an enterprise license key.
| Components | Main responsibilities | Precautions for production |
|---|---|---|
| PostgreSQL | Accounts, projects, and metadata | High availability, backup, and upgrades |
| ClickHouse | Large-scale tracking and analysis of data | Disks, object storage, and retention policies |
| Redis | Cache and temporary states | Memory limits and fault recovery |
| RabbitMQ | Asynchronous processing queue | Persistence, backlog, and monitoring |
| Quickwit | Full-text search index | Object storage, index size, and reconstruction |
| Frontend and App Server | Interfaces, APIs, and data processing | Version locking, scaling, and network access points |
Privacy and PII deletion
Cloud projects allow for server-side PII removal to be enabled before data is written; the input and output of each Span are scanned for names, email addresses, phone numbers, account details, and other personal information, which are then replaced with placeholders. The original text does not end up in the tracking storage or search indexes, but this feature only applies to new Spans once it has been enabled.
- The PII switch is configured on a project basis, rather than being set uniformly for the entire workspace.
- Existing historical tracking will not be automatically reprocessed.
- Structural information such as JSON field names, Span names, status, and costs is retained.
- The user ID through which metadata writes are tracked will not be deleted by this switch.
- Misidentification or missed identification can still occur; sensitive fields should be removed at an earlier stage in the process.
- Self-hosted teams are responsible for configuring access, encryption, backup, and deletion on their own.
Enterprise security capabilities
The public package comparison lists security features such as OAuth authentication, SOC 2 Type II compliance, HIPAA compliance, and server-side PII deletion; however, the specific packages available must be confirmed through the control panel and relevant contracts. The regulatory team should also review the terms related to sub-processors, data locations, retention periods, and incident response.
Which users are it suitable for
- Engineering team for developing multi-step AI agents.
- Platform teams that need to monitor the behavior of models, tools, and sub-agents.
- A quality team has been established to conduct regression testing in order to identify changes related to the model.
- It is hoped to identify products with production anomalies and the operators involved, using natural language.
- Data teams that require SQL, dashboards, and full-text search for analysis and tracking.
- Companies that wish to have a self-hosted, open-source observability platform.
- Developers who involve programming agents in the debugging loop.
Product advantages
- Provides a conversational tracking view for long-duration and multi-agent tasks.
- It is native to OpenTelemetry, making it easy to integrate with existing observability systems.
- Signals enables the identification of logical and business issues across the entire tracking process.
- The debugger reduces the cost of repeated calls by using cached playback.
- Evaluation, datasets, annotation, and production tracking form a closed loop.
- Supports SQL, MCP, CLI, and custom dashboards.
- The core platform and SDKs are licensed under permissive open-source licenses.
Restrictions and Precautions
- Comprehensive tracking may capture hints, tool results, and sensitive business data.
- Signals rely on model judgments, which may lead to false positives or false negatives.
- There is no simple way to convert Trace Tokens into storage GB.
- Free retains data for only 7 days and does not allow excess data.
- A complete self-hosted stack includes various databases and middleware, which makes it difficult to manage.
- Certain enterprise capabilities and integrations require commercial licenses.
- Cache replay cannot replace real end-to-end and load testing.
- The range of automatic instrumentation varies with the framework version.
Recommendations for selection and deployment
- Track the number of instances running, the average tracking size, and retention requirements.
- List the sensitive fields that must be tracked and those that must be excluded.
- First, integrate the SDK into the testing project and examine the Span structure.
- Decide whether to use cloud-based or self-hosted data boundaries.
- Establish initial Signals for errors, costs, and business outcomes.
- Construct a small regression dataset from production failures.
- Include testing in continuous integration while setting an appropriate level of concurrency.
- Observe the usage of GBs and Signals over a complete billing cycle.
- Create operation manuals for alerts, retention, deletion, and permissions.
- Regularly verify backups, upgrades, and disaster recovery.
Frequently Asked Questions
What is Laminar used for?
It is used for tracking, debugging, monitoring, and evaluating AI agents and large language model applications. The platform keeps a record of the operation of models, tools, and sub-agents, and provides Signals, datasets, SQL queries, and dashboards.
Is Laminar free?
The free cloud plan offers 1GB of data per month, a $5 credit for Signals, 7 days of data retention, 1 project, and 1 account. The core open-source code can be deployed by the user themselves, but the costs related to infrastructure and maintenance are borne by the user.
Is Laminar open source?
Yes, the core repositories and major SDKs are licensed under Apache License Version 2. Some enterprise images, integration features, licensing options, and hosting services remain part of the commercial offerings.
Will Signals read all trackers?
Only those traces that meet the corresponding trigger and filtering conditions are analyzed. The system first compresses the traces, and then an internal agent examines their complete execution, reading out the specific Spans as needed.
Can it be self-hosted?
Yes, for lightweight environments Docker Compose can be used, while for larger enterprises Helm can be employed for deployment on AWS or Google Cloud. In production environments, it is necessary to manage the database, search functions, object storage, backups, and security measures on one’s own.
Is Python and TypeScript supported?
Yes, there are official SDKs available for both languages, which enable automatic instrumentation, manual Span management, as well as function monitoring and evaluation. Before using them, it is necessary to ensure that the version of the framework is compatible with the current SDK.
Summary
Laminar integrates AI agent tracking, natural language generation monitoring, cache playback debugging, offline evaluation, and data analysis into a native OpenTelemetry platform. It is particularly suitable for engineering teams that need to understand the internal behavior of long-running tasks, rather than being satisfied with only the final output.
The managed version ranges from free to 150 dollars per month, with costs increasing based on the amount of data and Signals usage; the open-source version offers greater control over the data but requires full responsibility for its maintenance. The choice between these options should be made by considering factors such as the volume of data to be tracked, the retention period, sensitive information involved, the costs associated with Signals, and the complexity of self-management.
Tools similar to Laminar



 Guigong Network Security Registration No. 45132202000164