






Breadcrumb
Breadcrumb: an intelligent tool focused on improving AI efficiency.
Tags:AI improves efficiencyA one-sentence summary
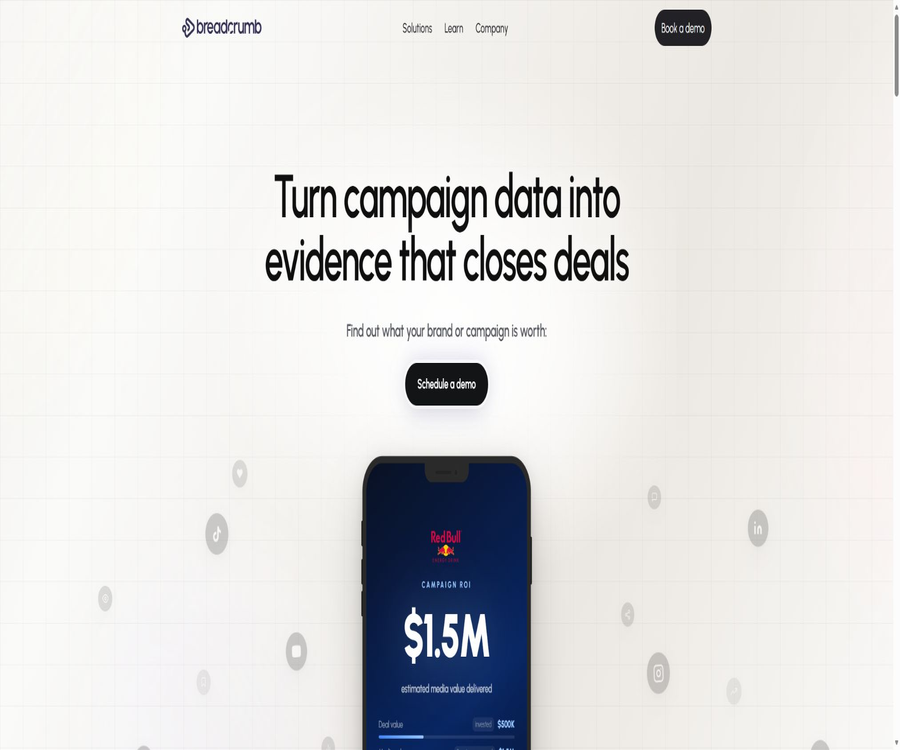
Breadcrumb is an AI-driven data analysis platform designed for brand partnership and sponsorship teams; it connects data on audiences, events, and revenue to generate interactive dashboards, ROI reports, and renewal analyses, while also allowing business professionals to query data using natural language.
Tool Introduction
Breadcrumb is operated by Breadcrumb Technologies Inc. Its official website describes the product as an intelligent ROI engine for brand collaborations, designed to serve sports teams and leagues, media networks, music labels, as well as travel and hotel companies. It does not merely display charts; rather, it transforms disparate data related to events, audiences, and business activities into information that can be used for pricing decisions, performance analysis, and contract renewal.
The official documentation still presents a fairly generic AI-native analysis platform, which includes data sources, Spaces, Groups, automated dashboards, natural language processing, report sharing, embedding capabilities, and developer APIs. The current sales model is more akin to enterprise solutions that include implementation services; it can no longer be described as a low-cost, self-service reporting tool intended for individual users.
Changes in the current product positioning
In its early stages, Breadcrumb focused on enabling non-technical teams to create data stories and customer reports using AI; the current homepage, however, emphasizes sponsorship value, the ROI of brand collaborations, and business renewals. The capabilities related to general operations, inventory, and order analysis that were covered in the old tutorials are still supported by official documentation, but when making purchases it is necessary to follow the scope of delivery as determined by the sales team at present.
| level | Current location | The abilities that remain intact | Pay attention when making a choice. |
|---|---|---|---|
| Main purpose of the official website | Brand partnership and sponsorship ROI engine | Analysis of audience, activation, revenue, and asset value | It is more suitable for organizations with clear business objectives. |
| Product documentation | AI-native data analysis platform | Data connections, dashboards, natural language Q&A, and reports | The specific functions may be configured according to the project. |
| Delivery method | Schedule a demonstration and have it carried out through team collaboration. | Space, permissions, embedding, and API | The price of the self-service packages is not made public. |
| Key industries | Sports, media, music, travel, and hotels | General analysis for marketing, sales, operations, etc. | Industry templates and data integration require individual verification. |
Main functions
Multiple upstream data connections
Breadcrumb enables the connection of spreadsheets, databases, and API interfaces within a single Space, allowing multiple datasets to be combined for analysis. The official website also emphasizes the consolidation of disparate data sources such as ticketing information, social media data, CRM details, account information, product data, and fan behavior into a unified business analytics framework.
Data quality inspection and combination
According to the official documentation, the platform can detect inaccurate, inconsistent, and missing data, as well as simplify the connection of datasets. However, automated processing cannot replace the responsibility of data managers in verifying primary keys, time ranges, currency types, refund rules, and attribution methods.
Automatically generate dashboards
After adding data, the user can define the analysis objectives and use Auto-Generate to create an initial dashboard. The resulting dashboard can be further customized by adjusting components, chart types, metrics, filters, and groupings, which reduces the time needed to build something from a blank canvas.
Natural language data Q&A
Sales representatives can use everyday language to ask questions about revenue, performance of various activities, audience segments, or the reasons for any changes; the system then generates charts, tables, KPIs, or reports based on the connected data. The dialogue allows for further questions to be asked and keeps the context intact, making it possible to move from overall trends to the specific factors that drive them.
Business semantics of Space Knowledge
Space Knowledge enables the definition of indicator meanings, data source details, business rules, unit formats, and the way AI should respond. By specifying in advance terms such as net revenue, conversion rates, active users, or sponsored assets, it is possible to reduce the risk of inconsistent interpretations and calculations by different people.
AI data tables and calculated fields
AI Tables can generate data tables based on natural language, and it allows users to add or remove columns, create calculated fields, sort data, apply filters, as well as perform pivot and summary operations. It is useful for viewing details and verifying charts, but complex formulas should still be cross-checked against the original queries and financial standards.
KPIs, charts, and rate of change
The platform supports KPI cards and various types of charts; it is also possible to set the format, targets, breakdown dimensions, and periodic change rates. The rates of change on a weekly, monthly, and annual basis are still marked as Beta in the official product updates, and they need to be recalculated before presenting key reports.
Groups and unified filtering
Groups allow multiple dashboards to be organized within the same Space, each serving different teams, projects, or data topics. The natural language Group Filter enables a set of components to apply conditions such as region, channel, time, or Top N simultaneously.
Report sharing and AI summaries
Breadcrumb enables the sharing of dashboards and the creation of dynamic reports with AI-generated summaries, which can be viewed by internal colleagues, customers, or sponsors. When addressing external parties, it is necessary to set read-only access, ensure data isolation, and provide appropriate explanations for the metrics; internal data should not be made publicly available by default.
Analysis of sponsorship value and contract renewal
Current products focus on aggregating factors such as overlapping audiences, content delivery, interactive elements in events, and attributable revenue to generate evidence of brand collaboration, which is then used in pre-investment planning, optimization during events, and discussions regarding contract renewal. When estimating the media value or net return, it is necessary to disclose the models, benchmarks, attribution periods, and assumptions used.
Agentic Reporting
As described by the officials, Agentic Reporting enables continuous monitoring of data based on specific trigger conditions, allowing for the generation of personalized reports that can be sent to relevant teams or partners. Automatic reporting is suitable for tasks with a regular cycle, such as ticketing speeds, sponsorship fulfillment, and consumption metrics. However, the figures cited in public materials regarding improved results are merely examples or marketing claims, and should not be considered as guaranteed outcomes.
Export and Embed
Individual visualization components can be exported as PNG, JPEG, or SVG, while datasets can be exported in CSV format. Developers can also generate secure embedding tokens to incorporate interactive components or dashboards into their own products using iframes.
Complete workflow
- First, determine the business decisions that need to be supported, such as sponsorship pricing, post-event analysis, customer reports, or preparation for contract renewal.
- Inventory data related to ticketing, CRM, social media, events, POS, accounts, and finance, and identify the owner of each channel.
- Create a Space and connect the necessary spreadsheets, databases, or APIs, to avoid importing irrelevant or sensitive fields at once.
- Define metrics, time ranges, currencies, attribution rules, and business terms to create a unified Space Knowledge.
- Let the platform generate the initial dashboard, and then verify each aspect such as connection relationships, aggregation methods, missing values, and abnormal values.
- Ask follow-up questions in natural language regarding performance, differences, and driving factors, and organize the reliable results into Groups or customer reports.
- Configure access, filtering, embedding, or export permissions for different stakeholders to prevent data leakage across clients.
- Before a formal decision is made, the business and data leaders review the formulas, samples, attribution methods, and the AI-generated text conclusions.
Create the first tutorial on analyzing Space
- Obtain an account through a demonstration or an organizational invitation, and verify that the project includes the required connectors, permissions, and support.
- Create a new Space, and in the name and description specify the business objectives, the time range of the data, and the person in charge.
- Add tables with a clear structure or authorized data connections, and check the field types, primary keys, and update times.
- Fill in Space Knowledge to standardize the definitions of various metrics such as revenue, interaction, exposure, conversion, and returns.
- Describe the issue you wish to analyze, so that Auto-Generate can create a preliminary version of the dashboard.
- Switch between charts, adjust indicators, group and filter data, and compare it with known samples or the figures from the original system.
- Create Groups to hold the high-level overview, operational details, and partner reports respectively.
- Set access permissions before sharing, and retain records of versions, approvals, and regular reviews.
Tutorial on creating sponsorship reports
- Clarify the reporting parties, duration of the cooperation, contractual assets, delivery commitments, and the renewal-related questions that need to be answered.
- Connects essential data such as the audience, content, ticketing, event interactions, leads, and attributable revenue.
- Define uniform calculation methods for exposure, engagement, media value, conversion, and net return.
- Components for the pre-campaign baseline, monitoring during the campaign, and post-campaign review are generated separately, with no mixing of different time periods.
- To investigate the underlying factors such as channels, content, audience, location, or time period behind abnormal changes.
- After the AI generates the summary, the responsible person checks the figures, the causal statements, and any conclusions that are not supported by the data.
- Create reports or embedded views that contain only the data of that partner, and test the boundaries of permissions.
- Freeze the version before the renewal meeting, and document the data cutoff date, assumptions, and responsibilities for subsequent updates.
Natural language questioning method
High-quality prompts should include business objectives, metrics, filtering criteria, time range and granularity, segmentation dimensions, as well as the type of output and its units. The more specific the question, the easier it is for the system to select the correct data and presentation method.
- First, specify the decision that needs to be supported or the hypothesis to be verified; do not use vague terms such as “sales report”.
- Specify metrics such as revenue, orders, interaction rate, or conversion rate, using the unified definitions provided in Space.
- Add additional filtering criteria such as region, channel, event, customer status, and data deadline.
- It specifies whether the display is on a daily, weekly, monthly, or quarterly basis, as well as the comparison period required.
- Tables, KPIs, or appropriate charts are required, along with specifications for the currency, percentage, number of decimal places, and Top N.
- First, look at the overall results; then, by asking further questions, identify the abnormalities, compare the different periods, and determine the main driving factors.
- Finally, it is required to summarize the key findings, while manually checking whether each conclusion can be directly supported by the data.
Which users are it suitable for
- Sports teams and leagues: integrate ticketing, fan, content, and sponsorship data to support pricing and contract renewal.
- Person in charge of brand partnerships: Organizes contract assets, communication performance, and attributable revenue into evidence relevant to the partners.
- Media networks: Analyze audience value, advertising reach, and the effectiveness of business partnerships.
- Music labels and live event teams: Assessing artist audiences, tour collaborations, and event interactions.
- Travel and hotel businesses: Assessing commercial value by combining data on visitors and partnership activities.
- Customer Success and Agencies: Create shareable customer reports and customer data views.
- Marketing, sales, and operations teams: Analyze various upstream data using natural language processing to create dashboards.
- Product development team: Integrates analytics capabilities into its own systems via APIs and embedding options.
Typical use cases
- Sponsorship program pricing: An interpretable range of values is established based on audience characteristics, content performance, and historical activation data.
- Monitoring during events: Tracking interactions, sales, and channel changes to identify any deviations from the expected performance in a timely manner.
- Partner review: Provides interactive reports that include only the relevant assets and metrics.
- Preparation for renewal: Gather data on performance, returns, growth, and risk indicators prior to the meeting.
- Segmenting fans and customers: Comparing the value of different regions, ticket types, spending patterns, and interaction groups.
- Automated customer reporting: Dashboards and AI summaries are updated at regular intervals, reducing the need for manual data entry.
- Operational analysis: Links order, inventory, and cost data to identify trends, anomalies, and predictive signals.
- Embedded analytics: Provides permission-controlled interactive components within the customer portal or internal systems.
Product advantages
- The current focus is on the practical business decisions related to sponsorship and brand partnerships, rather than merely providing general charts.
- Spreadsheets, databases, and API data can be combined to reduce the need for manual data aggregation across multiple systems.
- Natural language Q&A, follow-up questions, and automated dashboards reduce the barriers to using analysis tools for business professionals.
- Space Knowledge enables the solidification of metric definitions and business rules, thereby improving consistency across teams.
- Groups, unified filtering, and dynamic reporting are suitable for organizing content for different teams or partners.
- It supports export in image and CSV formats, and also enables interactive analysis through secure tokens.
- The publicly available documentation covers APIs for data sources, Space, embedding, and conversations.
- The current official website emphasizes implementation in collaboration with customer teams, and is suitable for projects that require data and business integration.
Usage restrictions and precautions
- Currently, there are no public prices for self-service packages; for information on budgets, contract durations, as well as the scope of implementation and support, it is necessary to contact the sales team.
- The main focus of the official website has shifted from general data communication to sponsor ROI; the skills covered in the older tutorials are not necessarily included in new projects by default.
- AI may choose the wrong data, connection patterns, aggregation methods, or metric definitions; important conclusions must be verified manually.
- Media value, audience overlap, and attributed revenue typically rely on assumptions, and the estimated figures cannot be regarded as actual cash returns.
- Automatic data validation cannot resolve issues such as missing data, duplicates, delays, and inconsistencies in the data format.
- Prediction and regression can only illustrate the relationships within a model; they cannot automatically prove causality or guarantee future performance.
- Certain KPIs, such as the rate of periodic variation, are still marked as Beta; the functions and outcomes may change.
- Data isolation at the tenant, customer, role, and field levels must be configured before sharing or embedding it externally.
- The data uploaded may contain personal information; the privacy policy recommends removing any identifiable details first.
- API keys must be obtained by contacting support; no unified rates, usage limits, or SDK specifications are listed in the public information.
- The terms of service permit the use of anonymous aggregated statistics to improve system performance, and companies must define the boundaries in the order and data agreements.
- The platform results are provided as they are; the official terms do not guarantee that the output will always be accurate, complete, uninterrupted, or suitable for a specific purpose.
Price and procurement methods
As of August 20, 2026, the link to the original price of Breadcrumb will redirect to a page for scheduling demos; the official website does not disclose the current cost of the packages, the price per seat, or the unit price per unit of usage. Public blogs mention that a 30-day trial period is available, but this is not a permanent free version or a uniform free trial offered to all users.
| Project | Currently available public information | Billing or cycle | Core content | Suitable for users |
|---|---|---|---|---|
| Product demonstration | Reservation | One-time communication | Integrate organizational data with target presentation plans | The team responsible for assessing compatibility is currently at work. |
| Pilot project | The official article mentions a 30-day pilot period. | Confirm by project | Verification around a specific report or monitoring workflow | Organizations that need to prove their value first |
| Official deployment | Custom quote | Subject to the order. | Data connectivity, analysis, reporting, permissions, and implementation services | Sports, media, music, and hotel businesses |
| API and Embedding | Unpublished independent price | Contact sales or support. | Data sources, Space, conversation, and embedding capabilities | Teams that require system integration |
The terms state that the costs are determined in accordance with the customer’s order or the official website; in cases of self-registration, payment is usually made on the first day of each month, while for custom orders, payment is due according to the dates specified on the invoice. The actual total cost also depends on factors such as the number of data sources, the migration of historical data, implementation efforts, the number of licenses required, usage levels, the level of support provided, integration requirements, and renewal terms.
Platform, output, and function status
| Ability | Status | Primary uses | Precautions |
|---|---|---|---|
| Web cloud platform | Support | Configure data, dashboards, and reports | An account or organizational invitation is required. |
| Natural language question answering | Support | Generate charts, tables, KPIs, and analyses | Reliance on data and semantic quality |
| Groups | Support | Organize multiple dashboards in Space | It is necessary to plan permissions and structure. |
| AI Tables | Published | Details, calculations, filtering, pivoting, and summarization | Complex formulas require manual verification. |
| KPI change rate | Beta | Comparison of weekly, monthly, and annual cycles | Re-calculate before going live |
| Batch component generation | Beta | Submit multiple analysis requests at once | It may change with version updates. |
| Image export | Support | PNG, JPEG, and SVG components | Suitable for documents and presentations |
| Data export | Support | CSV offline analysis | Be careful with the storage of sensitive data. |
| Secure embedding | Support | Customer portal or internal system | Tokens and access control are required. |
| Native desktop or mobile app | No public explanations were found. | It is primarily used through a browser. | Do not refer to responsive web pages as native applications. |
Data sources and analysis objects
| Type | Official confirmation method | Analyzes that can be used | Implementation precautions |
|---|---|---|---|
| Spreadsheet | Upload file | Activity, revenue, inventory, orders, and customer data | Maintain single-row headers, consistent fields, and uniform data types. |
| Database | Data connectors or Sources API | Continuously updated business data | Use read-only accounts and the minimum required permissions. |
| Business API | Connector or API integration | Third-party platforms and real-time business data | Confirmation of authentication, throttling, and handling of refresh failure scenarios |
| Google data | The official privacy policy confirms API access. | Channels or other authorized analyses | Comply with Limited Use and allow revocation |
| Sponsorship and event data | Key features of the current official website | Audience, assets, interactions, revenue, and renewal | Unified attribution window and contract criteria |
APIs and developer capabilities
Breadcrumb provides a public Developer Guide; API keys must be obtained by contacting support and are authenticated using dedicated request headers. The current documentation identifies four types of APIs: Sources, Spaces, Embed, and Conversations, but it does not disclose standard prices for self-service keys nor any unified rate limits.
| API | Key capabilities | Typical uses | Precautions for connection |
|---|---|---|---|
| Sources API | Manage database, file, and API data sources | Automatically establish or update data connections | Restrict credential permissions and monitor refreshes. |
| Spaces API | Create Space, data models, visualizations, and access. | Automatically configure the analysis environment based on the customer or project. | Isolate tenants and roles |
| Embed API | Generate embedding tokens and component settings | Embed the dashboard in your own products | Tokens should be issued by the server on a short-term basis. |
| Conversations API | Create conversations, send messages, and keep a history. | Add data Q&A to the own interface | Avoid unauthorized queries and the display of sensitive information. |
API integration process
- Contact the authorities to confirm that the project includes an API, and request a testing environment, keys, and relevant documentation.
- Create dedicated credentials for the server, and avoid storing API keys in browsers, mobile devices, or public repositories.
- First, use the Sources functionality related to Spaces to create minimal test data and an isolated Space.
- Establish server-side authorization mappings for user identities, customer ranges, and the data that can be queried.
- When embedding is required, a short-term token is issued on the server, with restrictions imposed on the components, users, and expiration period.
- For testing the dialogue interface, considerations include prompt injection, cross-tenant queries, timeouts, duplicate requests, and sensitive output.
- Log calls, errors, data refreshes, and permission changes, and verify throttling and fault handling with the authorities.
Privacy and data security
The Privacy Policy was last updated in June 2026; it outlines the types of information that may be collected, such as contact details, demographic data, information on device usage, location data, behavior patterns, as well as documents, spreadsheets, and database data that are uploaded. The company advises users to remove any personally identifiable information before the application processes it, and states that it does not sell personal data.
Personal data is generally retained during the period of service and for as long as it is necessary to fulfill service-related or legal obligations; the policy in place does not specify a fixed deadline for its deletion. Users can request that such data be deleted or that access to it be revoked, and companies are still required to define, through contracts, the specific time limits regarding production data, backups, logs, and copies held by third parties.
Google API data is intended solely for providing and improving the functions requested by authenticated users; it is not used for advertising, sales, or creating unrelated profiles, and it is retained only for as long as it is necessary to provide the services. This restriction does not automatically extend to cover all customer data, preventing its use in any aggregate statistics or for system improvements.
- Remove personal fields such as name, contact information, and unnecessary detailed locations before importing.
- Create read-only, minimally privileged credentials with quick revocation for database and API connections.
- Isolate Space, reports, export, and embedding tokens by customer, project, and role.
- The deadline for disclosing data in sponsorship reports, the estimation models, and the attribution assumptions.
- Limit CSV exports and local copies to prevent the loss of control over data once it leaves the controlled system.
- In the order, confirm the hosting region, encryption, sub-processors, event notifications, and deletion deadline.
- Regularly review conversations and automatic reports to prevent AI from presenting correlations as causal relationships.
Terms of Service and Intellectual Property Rights
The Cloud Services Agreement was last revised in March 2025; the customer retains the right to its Customer Data, and authorizes the platform to process such data within the limits necessary for providing the services. The platform may generate anonymous aggregated statistics based on usage patterns, for the purpose of optimizing system performance.
The service is primarily intended for use within the customer’s own business operations; the terms prohibit copying, reselling, reverse engineering, and the unauthorized disclosure of the platform or its documents. Rights related to reporting to external clients, embedding in portals, and commercial redistribution must be specified in the order – it cannot be assumed that unlimited rights for further licensing exist just because the platform can be shared.
Is it open source?
Breadcrumb is a closed-source commercial cloud service; its terms of service designate the platform, documentation, and related intellectual property as assets of the provider, and they impose strict restrictions on reverse engineering. No source code repositories for the product or official open-source SDKs have been found through public searches.
The official API and embedding interfaces are used to connect to the hosting platform; they do not represent the source code of that platform. GitHub projects with similar names cannot be considered official Breadcrumb repositories, nor should they be used as evidence to indicate that a product is open-source.
Basic information
| field | Content |
|---|---|
| Tool name | Breadcrumb |
| Operating entity | Breadcrumb Technologies Inc. |
| Current location | Intelligent ROI Analysis Platform for Brand Partnerships and Sponsorships |
| Scalability | AI data analysis, dashboards, reports, and embedded analytics |
| Key industries | Sports, media, music, travel, and hotels |
| Input channels | Spreadsheets, databases, and APIs |
| Main output | Charts, data tables, KPIs, dashboards, reports, and CSV |
| Price pattern | Book a demonstration, pilot project, and get a customized quote |
| Public free version | No results found at the moment. |
| Account method | Demonstrate, organize accounts, or invite |
| Chinese support | Natural language capabilities need to be tested; no complete Chinese interface was found as promised. |
| API | Provides Sources, Spaces, Embed, and Conversations APIs |
| Official SDK | No public SDK was found. |
| Official GitHub | No warehouse for certified products was found. |
| Is it open source? | Not open source |
| Main platforms | Web cloud platform, APIs, and web embedding |
Recommendation score
The recommendation score is 4.1 out of 5 points. Breadcrumb integrates various upstream data sources, natural language analysis, dashboards, customer reports, and security features; it also focuses its offerings on sponsorship benefits and brand partnership decisions, making it suitable for organizations that have specific needs in terms of business reporting.
The deductions are mainly due to the failure to disclose current prices, the need to verify each item individually in relation to old documents and the current scope of delivery following a change in product orientation, as well as the fact that AI-based attribution and value estimation still rely on data quality and manual review. Users who only need simple charts may find the procurement process and implementation methods to be overly complex.
Frequently Asked Questions
What is Breadcrumb?
It is an AI data analysis platform designed for brand partnership and sponsorship teams; it connects audience, event, and revenue data to generate interactive reports, dashboards, and ROI analyses.
Is Breadcrumb still a general-purpose data analysis tool?
The official documentation still offers general data connectivity, Q&A functions, and dashboards, but the main focus of the current website has shifted to sponsorship value and brand collaborations. It is necessary to verify whether these general capabilities are included in procurement projects.
Is Breadcrumb free?
At present, no publicly available permanent free version or self-service pricing has been found. The official website directs users to schedule demonstrations; official articles mention that a 30-day trial period is possible, but the conditions and costs must be determined on a case-by-case basis.
Can I upload spreadsheets?
Yes. The official documentation supports the upload of spreadsheets, as well as database and API data sources; it is also possible to combine multiple data sources.
Is it possible to use it without knowing SQL?
Sales professionals can create charts, tables, and dashboards using natural language, without having to write SQL queries for routine inquiries. However, data connections, semantic management, and complex validations may still require the involvement of data specialists.
How to improve the accuracy of AI analysis?
In Space Knowledge, it is necessary to define indicators, data sources, business rules, units, and AI behaviors; the objectives, filtering criteria, time frame, and output format should also be specified in the relevant questions. The final figures still need to be verified against the original system.
Is it possible to create a sponsor report?
Yes, and this is also one of the key features of the current website. Teams can combine data on audiences, content, events, and revenue to create reports that can be shared or embedded for partners.
Is data export supported?
Supported. Components can be exported in PNG, JPEG, or SVG format, while datasets can be exported in CSV format.
Is an API provided?
It offers Sources, Spaces, Embed, and Conversations APIs; keys must be obtained by contacting support. Prices, rate limits, and production support are not listed in the public documentation.
Is there an official SDK?
Currently, no public official language SDKs are available; developers rely primarily on API documentation and integration solutions to connect to the service.
Is Breadcrumb open source?
It is not open source. The fact that the official API is provided does not mean that the source code of the platform is made available; moreover, no open-source repositories for the products certified by the official website have been found.
Who owns the customer data?
The terms of service state that customers retain the right to their Customer Data, while granting the platform permission to process such data within the limits necessary for providing the services. The purchaser should also define the boundaries regarding backup, deletion, and aggregate statistics.
Will the data be sold?
The privacy policy states that personal data will not be sold. The platform may still use service providers to process the data, which can result in aggregated statistics that do not identify individual customers.
Is it suitable for individual users?
The current product is more suitable for organizations that have access to a large amount of upstream data, external reports, and clear requirements regarding business decisions. Individuals who create simple charts generally do not need this type of scheduled presentation or customized implementation service.
Tools similar to Breadcrumb



 Guigong Network Security Registration No. 45132202000164