






Viz-gpt
Viz-gpt, an intelligent tool specialized in AI-generated images
Tags:Common AI image toolsWhat is VizGPT?
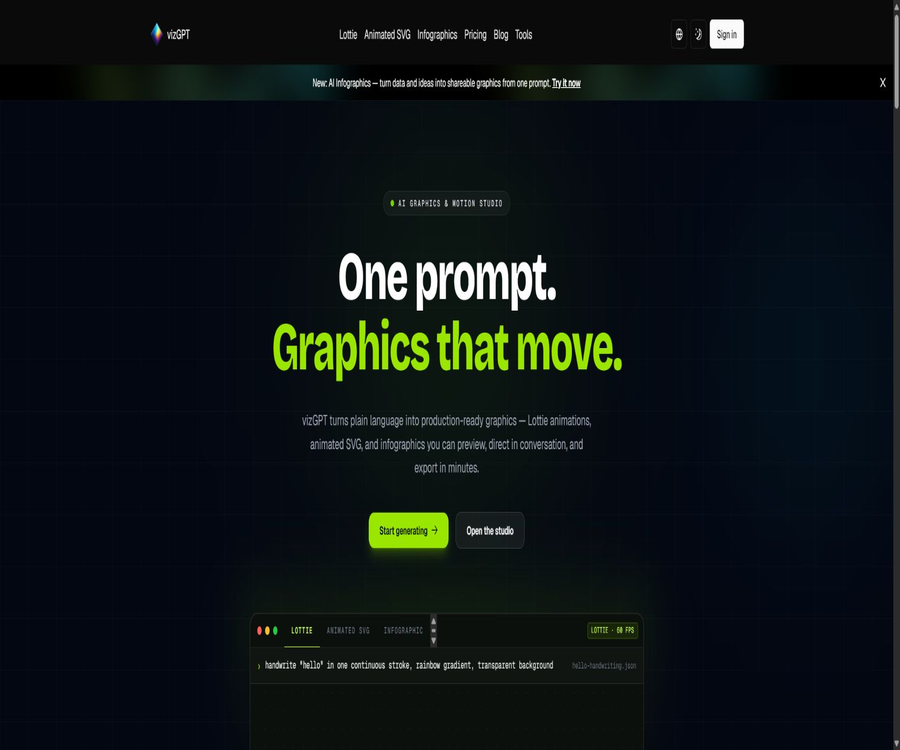
VizGPT is an AI-based platform for graphics, animations, and data visualization, developed by Kanaries Data, Inc. Users can use natural language to create Lottie animations, animated SVGs, infographics, images, and interactive charts; they can also make further adjustments to timing, colors, layout, and data presentation through dialogue.
In its early stages, VizGPT was primarily used for generating data charts through conversations; it has since evolved into a full-fledged AI Graphics & Motion Studio. The main functionality of this tool still includes the ability to conduct conversational data analysis, but it also covers vector animations and infographic creation, which are currently among its key features.
A one-sentence summary
An online visual studio that converts prompts, data, and conversations into editable Lottie files, animated SVGs, infographics, and interactive charts.
Current core functions
- Generate a Lottie JSON animation from a single prompt.
- Generate scalable, editable code-based animated SVGs.
- Format the data and opinions into a complete information diagram.
- Upload a CSV or Excel file and ask questions in natural language.
- Automatically recommends charts suitable for the fields and analysis objectives.
- Modify the visualization gradually through contextual dialogue.
- Use the canvas to drag and adjust the elements of the infographic.
- Generate AI images using various models.
- Use the general chat and Agent data analysis modes.
- Preview, convert, and export in formats such as Lottie, SVG, GIF, etc.
AI Lottie Generator
Lottie is a format that uses JSON to describe vector animations, and it is suitable for use in web pages as well as in iOS and Android interfaces. VizGPT breaks down the scene into layers, keyframes, and easing curves, then compiles them into playable Lottie files.
- Generate multi-layer animations from textual descriptions.
- It supports easing methods such as springs, Bézier, and hold.
- Preview the playback effect and looping rhythm in real time.
- Adjust the speed, color, and actions using subsequent conversations.
- Export Lottie JSON for use in product interfaces.
- Suitable for loading animations, success messages, guidance pages, and subtle icon interactions.
- The generated result still needs to be tested for compatibility in the target player.
AI animation SVG
Animated SVG uses vector graphics and CSS or SMIL animations to create motion, and it remains clear even when scaled. It is suitable for use on website home pages, for creating rotating icons, for drawing lines, and for implementing small decorative animations.
- Generate vector graphics and looping animations from short prompts.
- The output is SVG code that can be viewed and edited directly.
- Adapted for responsive web pages and different screen densities.
- Files are usually smaller in size than bitmap videos.
- You can continue to modify the colors, paths, and animation timing.
- SMIL and complex filters do not always exhibit the same level of compatibility across different environments.
AI infographics
The infographic generator creates a layout that includes titles, charts, number cards, and explanatory text, based on text, statistical data, and narrative structure. Users can make adjustments through dialogue, or they can directly drag elements to arrange them as desired.
- Generate a complete infographic layout from the theme and key points.
- Convert statistical data into charts and key figures.
- Automatically organizes titles, sections, annotations, and visual hierarchy.
- Modify color, density, and content using natural language.
- Move and edit elements directly on the canvas.
- It can be exported for use on social media, in reports, and in presentations.
- All facts and statistical data must be reviewed before publication.
Dialogic data visualization
VizGPT can read table data and generate charts in response to natural language queries such as “showing sales trends” or “comparing growth rates across different regions”. The context of the conversation is retained from previous queries, which facilitates further filtering, grouping, or changing of charts.
- Upload CSV or Excel data.
- Identify field types such as numbers, categories, dates, etc.
- Specify metrics, dimensions, and filtering criteria in natural language.
- Generate bar charts, line charts, scatter plots, pie charts, and more.
- Refine the same analysis based on new issues that arise.
- Manually adjust field mappings in the drag-and-drop interface.
- Save charts and session history.
- More complex data analysis is carried out through the Agent pattern.
Contextual memory and iterative modification
Traditional text-to-image tools often require rewriting the entire prompt each time, whereas VizGPT emphasizes a dialogue-based approach. Users can make incremental requests such as \"slower pace,\" \"change to warm colors,\" \"add a bouncing effect at the end,\" or \"show only data from the fourth quarter of last year.\"
- Retain the context of the charts and animations from the previous round.
- Make incremental adjustments to the local parameters.
- Avoid re-describing the entire scene every time.
- Transform the exploration process into a coherent analytical record.
- Even in long sessions, misunderstandings of context can still occur.
- Key versions should be exported and saved in a timely manner.
Charts and free tools
VizGPT also offers a set of ready-to-use charts, animation conversion tools, sticker processing functions, and calculator tools. Some of these conversions take place in the browser, making them suitable for simple tasks that do not require AI generation.
| Tool category | Representative tool | Primary uses |
|---|---|---|
| Chart creation | Bar charts, line charts, pie charts, scatter plots, radar charts | Quickly map fields and export charts |
| Lottie editing | Editor, previewer, Lottie to GIF converter | Adjust layer colors, check playback, and perform format conversion. |
| Vector conversion | Lottie to SVG, SVG to Lottie | Convert between vector format and animation format |
| Video conversion | Convert video to Lottie | Track or package short videos as Lottie |
| Sticker tool | Size conversion for TGS, GIF, WebM, and stickers | Create Telegram or WhatsApp stickers |
| Data tools | SQL formatting and regression calculations | Process query texts or perform basic statistical tasks. |
| General calculator | Calculators for finance, chemistry, and daily use | Complete calculations using explicit formulae. |
How to create Lottie animations
- Go to VizGPT’s Lottie generator and log in to your account.
- Specify the subject, duration, repetition pattern, and background requirements.
- Describe the motion path, easing effect, and key actions.
- Submit to generate and wait for a playable preview.
- Check the number of layers, the sequence of actions, and the iterative joints.
- Adjust the speed, color, or elasticity via subsequent messages.
- Manually correct layers and colors in the editor.
- Export the Lottie JSON and save a version.
- Testing was carried out in Web, iOS, and Android players respectively.
- Check the file size, performance, and accessible alternative content.
Format for Lottie prompt writing
| Components | A description is needed. | Example direction |
|---|---|---|
| Main body | Icons, characters, or graphics | Upload icon to the cloud |
| Action | Move, scale, rotate, or draw paths | The arrow bounces upward and then falls back down. |
| Duration | Total duration and key milestones | 1.8-second cycle |
| Easing | Spring, constant speed, or gradual acceleration and deceleration | A slight spring is used at the end. |
| Color | Primary colors, gradients, and transparency | Blue-to-purple gradient, soft glow |
| Background | Transparent, solid color, or canvas | Transparent background |
| Cycle | Seamless loop or play once | Seamless loop, consistent from beginning to end |
| Uses | Loading, button feedback, or home screen | Progress indication for uploading on mobile devices |
How to create data charts
- Remove empty rows, merge cells, and eliminate duplicate column headers in CSV or Excel files.
- Standardize the format of dates, currencies, percentages, and missing values.
- Upload the data and check the automatically identified field types.
- Use one sentence to clarify the indicators, dimensions, time frame, and filtering criteria.
- Check whether the chart selected by the system is suitable for the purpose of the analysis.
- Continue asking questions to compare groups, time periods, or outliers.
- Adjust field mappings, colors, and labels by dragging on the interface.
- Check the aggregation method, axes, and data range in the chart.
- Export the chart and indicate the data criteria in the report.
Chart selection suggestions
| Analysis objectives | Recommended charts | Common misconceptions |
|---|---|---|
| Compare different categories | Bar chart or histogram | Too many categories lead to crowded labels. |
| Observe time trends | Line chart or area chart | The dates are not sorted or the time granularity is chaotic. |
| View variable relationships | Scatter plot or bubble chart | Confusing correlation with causation |
| Show the composition percentages | Stacked bar charts or a small number of pie charts | Too many categories: still use a pie chart. |
| Compare multiple indicators | Radar chart or multiple small charts | Direct comparison of quantities with different dimensions |
| Observe the distribution | Histogram, box plot, or density plot | The bucketing settings conceal the true structure. |
| Regional differences | Map or zoning heat map | The size of the area leads to incorrect judgments of values. |
AI image generation
The paid plans offer AI-based image generation capabilities, and the price page lists various series of image models. The names of these models, their versions, and their availability may vary depending on the platform; before starting actual production, it is necessary to check in the workspace which models are available, how many credits will be used, and what the commercial terms are.
- Generate infographic images and visual materials based on text.
- Explore styles and character directions for animated scenes.
- Create social media images and display backgrounds.
- Different models have varying qualities, speeds, and integration costs.
- The text, characters, and brand elements in AI-generated images need to be reviewed.
- The free plan does not include AI image generation at the moment.
Member price
The following are the monthly prices in US dollars as displayed on the official pricing page during verification in August 2026. The platform also offers an annual payment option; however, the annual price was not shown consistently during this data collection, so no estimation can be provided.
| Plan | Monthly price | Monthly points | Suitable for users |
|---|---|---|---|
| Free | $ | 100 points | Experience chat and advanced data visualization |
| Basic | 10 dollars | 800 points | Lottie, SVG, and images are generated occasionally. |
| Pro | 39.9 dollars | 4000 points | Frequently carry out AI generation and Agent analysis. |
| Ultra | 99.9 dollars | 12,000 points | High-frequency production, batch animations, and intensive Agent workflows |
Comparison of package features
| Functions | Free | Basic | Pro | Ultra |
|---|---|---|---|---|
| General AI chat | Includes | Includes | Includes | Includes |
| Advanced data visualization | Includes | Includes | Includes | Includes |
| AI Lottie | Not included | Includes | Includes | Includes |
| AI animation SVG | Not included | Includes | Includes | Includes |
| AI image generation | Not included | Includes | Includes | Includes |
| Advanced models | Not included | Includes | Includes | Includes |
| Agent data analysis | Not included | Includes | Includes | Includes |
| AI animation generation | Not included | Includes | Includes | Includes |
The Free plan card at the top of the pricing page lists various features, but the detailed comparison table below specifies that Lottie, SVG, images, advanced models, Agents, and animations are not included. The information provided in the main text should be based on this detailed comparison table.
Points rules
The points associated with all packages are reset on a monthly basis; neither the monthly nor annual payment plans result in an accumulation of points for the next period. Pro offers a discount of about 20% on the price per point compared to Basic, while Ultra provides a discount of around 33%.
- Free offers 100 points per month.
- Basic offers 800 points per month.
- Pro offers 4,000 points per month.
- Ultra offers 12,000 points per month.
- Different models and tasks may require different amounts of points.
- Unused points become invalid during the monthly refresh.
- Test with a small number of results first before submitting a large number of tasks.
- The pricing and point rules may change depending on the model costs.
Comparison of cost per point
| Plan | Monthly price | Monthly points | Approximately per 1,000 points |
|---|---|---|---|
| Basic | 10 dollars | 800 | 12.50 dollars |
| Pro | 39.9 dollars | 4000 | 9.98 dollars |
| Ultra | 99.9 dollars | 12000 | 8.33 dollars |
The table compares only the price of the packages and the number of points earned; it does not represent the fixed cost per animation or image. The actual cost of a task depends on the specific model, output type, length, complexity, and the platform’s pricing rules.
How to choose a package
| Frequency of use | Suggested solution | Judgment method |
|---|---|---|
| Only perform chart analysis. | Free | Advanced data visualization is already included. |
| Occasionally create animations or images. | Basic | First, estimate the number of tasks per month and the points assigned to each task. |
| Generated continuously on a weekly basis | Pro | 4000 points and advanced models are more suitable for regular production. |
| Large numbers of batches and Agent workflows | Ultra | The single-integration approach has a lower cost and offers the highest capacity. |
| The requirements are not yet clear. | Upgrade monthly after becoming Free | Avoid being unable to estimate consumption before making an annual payment. |
Subscription and payment
The platform offers monthly and annual payment options, with the possibility to cancel at any time; payments are processed through Stripe. The timing at which benefits cease after cancellation, as well as the rules regarding refunds for annual subscriptions and taxes, are specified on the settlement page and in the latest terms and conditions.
- Before purchasing, confirm whether it is a monthly or annual payment plan and the total amount to be deducted at one time.
- The points are reset each month and are not issued once a year regardless of the annual payment option.
- Save the order, plan benefits, and renewal date.
- After canceling the subscription, check whether it is still possible to use the current points.
- Do not wait until the points are updated before raising a dispute regarding the balance.
- Before making a purchase, companies should verify the invoices, seating arrangements, and data-related terms with the authorities.
Supported export formats
| Format | Suitable uses | Key points of inspection |
|---|---|---|
| Lottie JSON | Vector animations for web pages and mobile apps | Player version, layers, and file size |
| Animated SVG | Website icons, homepage layout, and micro-interactions | Browser compatibility and script security |
| GIF | Chat, emails, and general preview | Volume, color, and transparency |
| Static SVG | Icons and scalable graphics | Font to path conversion and external references |
| Images such as PNG | Infographics and report illustrations | Resolution, clarity, and background |
| Chart configuration or interaction results | Data analysis and Web embedding | Data definition and dependent version |
Lottie production inspection
- Test it in the target Lottie player, rather than just relying on the web preview.
- Verify that the rendering results on mobile and web versions are identical.
- Check compatibility with transparent backgrounds, masks, gradients, and filters.
- Control the number of layers, path points, and embedded images.
- Verify the first and last frames of the seamless loop.
- Provide a static alternative for users who prefer to avoid dynamic effects.
- Do not place raw, unprocessed JSON directly in high-privilege environments.
Data analysis inspection
- Check the field types, date formats, and missing values.
- Confirm whether the aggregation method is summation, average, or counting.
- Check the filtering criteria and time range.
- Avoid truncating the coordinate axes to prevent exaggerated differences.
- Do not present correlation as causation.
- The chart indicates the source of the data, the units used, and the date of update.
- Independent recalculation of financial, medical, and research results is carried out.
- AI explanations can only serve as clues for analysis; they cannot replace evidence.
What use cases are suitable?
- The product team creates loading, success, and guidance animations.
- Front-end developers create lightweight Lottie or SVG animations.
- The designer quickly explores various options for icons and the animations on the home screen.
- Marketers create data-driven infographics.
- Analysts explore sales and operational data using natural language.
- Students convert research data into easy-to-read charts.
- Content creators produce social media graphics and GIFs.
- The team rapidly iterates on the visual versions through dialogue.
- Users with no experience in animation software can create simple micro-interactions.
Tasks that are not suitable for completion directly
- Complex character animations that require precise control frame by frame.
- Final assets with extremely strict requirements regarding brand guidelines, font styles, and animation standards.
- Analyses that contain highly sensitive data but have not yet undergone privacy and contractual reviews.
- A comprehensive data engineering solution is required, including large-scale ETL processes, data cleaning, and complex calculations.
- High-risk reports that require AI to automatically ensure the accuracy of statistical conclusions.
- Enterprise workflows that require a completely offline deployment.
- Projects that require the complete source code of the SaaS platform as well as its deployment in a private environment.
- Upload any Lottie file directly without performing cross-platform testing.
Product advantages
- Integrate data visualization, vector animations, and infographics in one platform.
- Use natural language to lower the barrier to creating charts and animations.
- It supports incremental, dialogue-based modifications, eliminating the need to rewrite the entire requirement repeatedly.
- Lottie output is suitable for Web, iOS, and Android.
- Animated SVG files are lightweight and allow for further code editing.
- Infographic supports both AI-based layout and canvas dragging.
- Free chart and format conversion tools are provided.
- With the Free plan, you can take advantage of advanced data visualization for an extended period of time.
- The capacity tiers of Basic, Pro, and Ultra are clearly defined.
- Kanaries boasts a mature open-source data visualization ecosystem.
Usage restrictions and precautions
- The current product is no longer just an early version of a chat tool for data charts.
- There is ambiguity in the presentation between the Free card and the detailed comparison table.
- The points are reset each month, and any unused amount is not carried over.
- AI-generated animations may still contain invalid or inefficient layers.
- Not all Lottie players support the same features.
- Scripts, SMIL, and filters in animated SVGs need to be checked for compatibility.
- Statistical interpretations generated by AI may contain errors or involve overgeneralization.
- Complex data cleaning and computation were not the strengths of the early version of VizGPT.
- The model names, functions, and the amount of points required will change as the platform is updated.
- Uploading data to the cloud requires an assessment of privacy and compliance issues.
- The subscription service does not make its complete source code available to the public.
- The old version of the GitHub repository does not represent the full scope of what is available on the current commercial platform.
Privacy and data processing
According to the privacy policy, the platform may collect names, email addresses, job titles, contact preferences, authentication details, billing addresses, and payment-related data; it also automatically collects IP addresses, browser information, and device specifications. Payment data is stored by the payment processing service providers.
- Do not upload unnecessary personal identification or confidential business data.
- Anonymize the customer data and minimize the number of fields used.
- Verify read-only permissions before using the database connection.
- Delete or replace fields such as name, email, phone number, and address.
- Check hidden tags and metadata before sharing charts publicly.
- The platform may process information for account, order, security, and marketing purposes.
- The privacy policy statement is not intended for minors under 18 years of age.
- Users who meet the criteria can request access to, correction of, deletion of, and migration of their data.
Account and Content Terms
Users are required to keep their account information accurate and to protect their passwords. The terms of service allow the platform to suspend or terminate accounts in case of rule violations or other issues; purchase orders may also be rejected or canceled due to service unavailability, price errors, or problems with the orders themselves.
- Do not share accounts and payment credentials.
- Avoid uploading data and materials for which you do not have permission to use.
- The original content and functions of the platform belong to Kanaries and its licensors.
- Users are not allowed to copy or use the platform’s content for commercial purposes without permission.
- Important projects require regular export of charts, animations, and raw data.
- The service is provided as it is, and no guarantee is given of its continuous error-free operation.
GitHub and the open-source ecosystem
The official GitHub repository of Kanaries is responsible for maintaining data visualization tools such as PyGWalker and Graphic Walker; however, no complete source code repository for the vizGPT commercial platform has been found. The open-source status indicated in the catalog should be stated as “the platform itself is not open source, but its related components are”.
| Project | Function | Public and Licensing |
|---|---|---|
| vizGPT commercial platform | Lottie, SVG, infographics, and AI analysis | No complete source code for the platform was found. |
| Early viz-gpt repository | Generate Vega-Lite charts from dialogue | Source code is publicly available under the Elastic License 2.0 |
| PyGWalker | Convert the DataFrame into an interactive visual analysis interface. | Apache License 2.0 |
| Graphic Walker | Embeddable drag-and-drop data visualization | Community open-source projects |
| Vega-Lite | Declarative chart syntax | The important visualization foundations of early VizGPT |
The viz-gpt repository maintained by ObservedObserver in the early stages was closely linked to the Kanaries ecosystem and pointed to the VizGPT online service; however, it only covered the basic capabilities related to interactive charts at that time. Elastic License 2.0 prohibits providing the main functions of this software as a hosted service to third parties.
The differences between PyGWalker and VizGPT
| Comparison items | VizGPT | PyGWalker |
|---|---|---|
| Form | Online SaaS Studio | Python libraries |
| Core entrance | Prompt, chat, and canvas | The interactive drag-and-drop interface in Jupyter |
| Key capabilities | Animations, infographics, images, and data analysis | Exploration, cleaning, and visualization of DataFrames |
| Deployment | Use official cloud services | It can be installed in a Python environment. |
| Costs | Free points and subscriptions | The open-source library itself is free. |
| Data control | Uploading data or connecting to cloud services | It can be processed within the user’s environment. |
| Suitable for users | Design, marketing, analytics, and product teams | Python data analysts and developers |
Basic information
| field | Content |
|---|---|
| Tool name | VizGPT |
| Operating company | Kanaries Data, Inc. |
| Tool type | AI-powered graphic animations, infographics, and data visualization platforms |
| Main inputs | Natural language, CSV, Excel, and visual data |
| Main output | Lottie, animated SVG, GIFs, infographics, and interactive charts |
| Free quota | 100 points per month |
| Basic | $ |
| Pro | $ |
| Ultra | $ |
| Is installation required? | No |
| Are free tools available? | Yes |
| Is the platform open source? | No |
| Related open-source projects | Early versions of viz-gpt, PyGWalker, and Graphic Walker |
Recommendation score
4.6 / 5. VizGPT extends conversational data analysis to Lottie, animated SVGs, and infographics; its output formats are suitable for use in product and web workflows, and there are many free tools available. However, cross-platform compatibility, data privacy, credit consumption, and the accuracy of AI-generated insights still require human oversight.
Frequently Asked Questions
Can VizGPT only create data charts?
It cannot be understood in that way. Currently, VizGPT is capable of generating Lottie animations, animated SVGs, infographics, and AI-generated images, and it also offers a variety of tools for format conversion.
Is VizGPT free?
A free plan is available, offering 100 points per month as well as basic chat functionality and advanced data visualization. AI Lottie, SVG, images, and the Agent mode require a paid plan.
How much does a VizGPT membership cost?
In August 2026, the monthly subscription fees will be $10 for Basic, $39.90 for Pro, and $99.90 for Ultra. The prices and any annual discount rates are indicated on the payment page.
Do the points accumulate?
No. According to the official guidelines, the points for both monthly and annual payment plans are reset on a monthly basis, and any unused balance cannot be carried over to the following month.
Can Lottie be used directly in apps?
It can be used as a lightweight animation format for Web, iOS, and Android, but it is necessary to check compatibility, performance, layers, and visual effects in the target player.
Is it possible to upload CSV and Excel files?
Supported. Users can upload table data and ask questions in natural language; thereafter, they can adjust the charts through dialogue and dragging.
Will VizGPT automatically ensure accurate data analysis?
No. Errors can occur in field identification, aggregation, filtering, and AI-based interpretation; therefore, important conclusions must be verified by checking the original data and performing recalculations independently.
Is VizGPT open source?
Current commercial platforms do not provide their complete source code publicly. The earlier viz-gpt repository, as well as related projects such as PyGWalker and Graphic Walker from Kanaries, did release their source code, but this is not equivalent to the source code available for existing SaaS platforms.
Tools similar to Viz-gpt




 Guigong Network Security Registration No. 45132202000164