






Guide
Ceyin: an intelligent tool focused on AI-driven conversations.
Tags:AI dialogue chatWhat is guidance?
MyInvestPilot is a systematic investment analysis platform operated by independent developers. It helps users transform vague investment ideas into rules that can be observed and verified, through strategies backtesting, simulated portfolios, market monitoring, the establishment of trading rules, and AI-based analysis.
CeYin is not a brokerage firm, investment advisor, or automated trading platform; it does not connect to users’ securities accounts nor place orders on their behalf. The options “Buy,” “Sell,” and “Trading Signals” on the page merely indicate the technical triggers used by the algorithm in a simulated environment.
Core functions
- Strategy backtesting: Examine the simulated performance of the rules using historical market data.
- Official combination: Typical example of a strategy maintained by the observation platform.
- Custom simulation combination: Select the underlying asset, strategy, funding rules, and parameters.
- Signal tracking: View simulated statuses such as buying, holding, selling, and being out of position.
- Email reminder: Receive notifications for the strategy signals of your own custom combinations.
- Market monitoring: Covers A-share markets, U.S. stock markets, and cryptocurrency assets.
- Chat2Invest: Use natural language to query information on stocks, portfolios, and strategies.
- Comprehensive analysis: View metrics such as returns, drawdowns, volatility, trading activity, and risk factors.
- Primitive strategy: Combine indicators, conditions, capital, and risk management rules in a manner similar to building with blocks.
- Signal Insights: Check the health, validity, volatility, and abnormal conditions of the data.
- Strategy Time Machine: Compares the impact of different historical starting points on the simulation results.
- Agent Lab: Use your own coded agents to connect to research interfaces for one-time experiments.
- Knowledge document: Explains strategies, metrics, backtesting, and systematic investment methods.
Ce Yin is not anything.
- It is not a stock recommendation service that tells users what to buy tomorrow.
- It is not a quantitative product that can guarantee returns.
- It is not a trading robot that automatically connects to brokers and executes orders.
- It is not a system that provides definite predictions about future market trends.
- It is not a registered investment advisory service or personalized financial planning service.
- It is not a ranking of returns that ignores drawdowns, slippage, and liquidity.
- It is not an agent that allows AI to take on the responsibility for making account-related decisions on behalf of the user.
Which markets are supported?
The official website states that it currently supports the A-share market, the U.S. stock market, and the cryptocurrency market; there are over 17,000 stocks and ETFs available. The frequency of data updates, trading days, methods for adjusting prices, fees, and trading rules vary across different markets.
| Market | Primary uses | Key risks |
|---|---|---|
| A-share market | Research on Stock and ETF Strategies | Price limits, suspension of trading, restoration of trading rights, and trading restrictions |
| US stocks | Analysis of stocks, ETFs, and leveraged products | Time zones, exchange rates, stock splits, pre-market and post-market trading, and taxes |
| Cryptocurrencies | Simulation strategies for assets such as Bitcoin | 24/7 trading, extreme volatility, and differences among exchanges |
How to start using CeYin
- Start by choosing an official combination from a market that you are familiar with.
- Examine the target pool, trading strategies, and capital allocation strategies of the reading portfolio.
- View the maximum drawdown, recovery time, number of trades, and performance from different starting points.
- Confirm that you understand that the signal merely represents the analog trigger condition.
- Apply for a trial version or choose the monthly payment option; there’s no need to rush into purchasing a long-term plan.
- Copy a simple strategy and create a custom simulation portfolio.
- After subscribing to the signal, observe multiple market phases in succession.
- Regularly use AI and signal insights to review strategies, rather than pursuing short-term gains.
How to structure a portfolio
A simulation portfolio typically consists of a trading strategy and a capital allocation strategy. The trading strategy determines when signals should be generated, while the capital allocation strategy decides how much capital should be invested in the simulation environment.
| Composition | The questions answered | Example |
|---|---|---|
| Target pool | Study which assets | A-share ETFs, U.S. stock ETFs, or crypto assets |
| Trading strategy | When to buy, hold, or sell | Double moving averages, momentum, chandelier stop loss, buy and hold |
| Funding strategy | How much virtual capital is used each time? | Fixed ratio, regular investment, target weight, or differentiated allocation |
| Risk rules | When to restrict or exit from risks | Stop-loss, maximum position size, and number of underlying assets |
| Execute rules | How does a signal turn into an actual transaction in analog form? | Funding, price buffers, and order thresholds |
Built-in trading strategies
- Double moving average strategy: A signal is generated when the short-term moving average crosses above or below the long-term moving average.
- Chandelier stop-loss strategy: A dynamic exit line is established based on ATR and the phase highs.
- Buy-and-hold strategy: Suitable for long-term holding and systematic investment.
- Momentum rotation: Select assets with a stronger historical momentum from among multiple targets.
- Target weight strategy: Adjust according to a set ratio, and rebalance when a threshold is reached or exceeded.
- Primitive strategy: Use verifiable components to combine custom transparent rules.
- File strategy: Structured files are used to provide strategic input for Agent research.
- AI large model strategy: Utilize multi-dimensional information to generate experimental signals.
Funding strategy
| Funding strategy | Simulation method | Suitable scenarios |
|---|---|---|
| Percentage of total assets | Invest a fixed percentage of the total assets each time. | Proactive strategies and multi-asset portfolios |
| Cash percentage | A fixed proportion of the available cash is invested each time. | Single-asset or near-full-position strategy |
| Regular fixed amount | Invest a fixed simulated amount on a monthly or annual basis | Regular long-term investment |
| Target weight rebalancing | Buy and sell to specified asset weights | Portfolios of equities, bonds, funds, etc. |
| Differentially allocated positions | Each target has a different maximum ratio set. | Multi-asset risk stratification |
| Cash management targets | When there are no positions held, the idle funds are invested in designated assets. | Trend strategies with longer periods of inactivity |
Primitive strategy system
The primitive strategy combines indicators, comparisons, logical conditions, signals, capital, and risk rules to form a structured configuration. It emphasizes transparent, verifiable, and reproducible rules, making it suitable for users who do not wish to write programs but still want to understand the logic behind the strategies.
- Indicator components: moving averages, RSI, MACD, Bollinger Bands, etc.
- Conversion component: Converts prices or indicators into intermediate variables such as relative strength.
- Comparison components: greater than, less than, intersection, and threshold evaluation.
- Logical components: AND, OR, NOT, and multiple conditional combinations.
- Signal components: Define the buy, sell, hold, and empty position states.
- Funding component: Set the contribution ratio, weight, and position size.
- Risk components: control of stop-loss levels, position sizes, and abnormal conditions.
- Structured Schema: Checks fields, types, and constraints before execution.
Current boundary of the primitive strategy
According to the official documentation, the primitive system is based primarily on price data such as opening prices, highest prices, lowest prices, closing prices, and trading volumes to generate technical indicators. Chat2Invest can provide analysis of fundamental and news-related factors, but this does not mean that all fundamental indicators can be used directly as primitive components.
- Most primitives are based on daily price and trading volume.
- The supported range for complex fundamental factors must be verified according to the current schema.
- Strategies that use multiple time frames increase the difficulty of data alignment and state management.
- Dynamic market conditions and adaptive parameters may go beyond the capabilities of existing components.
- Complex combination optimization requires more detailed handling of individual transactions and weight calculations.
- It is not possible to run any Python or JavaScript policy code directly on the platform.
How to create primitive strategies
- State the strategy assumptions, target, and time period in one sentence.
- Start with simple indicators and avoid combining too many conditions at once.
- Assign clear names and parameters to each indicator and constant.
- Define buy and sell conditions using comparison and logical components.
- Select a funding strategy that is consistent with the trading logic.
- Use Schema validation to check whether the configuration is complete and valid.
- Run backtesting and check the signal sequence, trades, and cash changes.
- Change the sample interval, parameters, and starting point for position building to conduct robustness checks.
- Record the failed results; not just keep the best-performing version.
Backtesting metrics
| Indicators | What does it represent? | It doesn’t tell us anything. |
|---|---|---|
| Cumulative returns | Simulated changes in net value during the sample period | The same benefits will surely be achieved in the future. |
| Annual compound return rate | Convert long-term returns into annualized compound interest | This value is consistently reached every year. |
| Maximum drawdown | The maximum decline from the historical peak to the trough | Future loss cap |
| Volatility | Degree of variation in historical returns | All tail risks |
| Sharpe ratio | Excess return corresponding to unit volatility | Real trading experience and liquidity |
| Win rate | Proportion of profitable trades | A strategy is either good or bad. |
| Profit and loss ratio | Relationship between average profit and average loss | Financial pressure after ignoring the order of transactions |
| Recovery period | Time required to return to the previous high after a historical pullback | It will definitely be possible to recover in the future. |
Time machine and tests with different starting points
A time machine is used to compare the performance of the same strategy when the simulation starts in different years or dates. Significant differences in the results may indicate that the strategy is too sensitive to the timing of position establishment, market cycles, or certain market conditions.
- Compare multiple bull, bear, and volatile market phases.
- View the maximum drawdown and recovery time for different starting points.
- Check whether the returns are concentrated in a few years or transactions.
- Observe whether slight changes in parameters lead to significant changes in the results.
- Do not show only the most favorable starting points.
- Treat the periods with poor performance as evidence of risk.
Simulated trading mechanism
After a buy signal is generated, the capital strategy also takes into account the available funds, the minimum order value, and price conditions. The appearance of a signal on the page does not necessarily mean that a transaction will be completed for the simulated portfolio.
- A regular purchase allows for a buffer of about 5% in terms of price increase and additional costs.
- Price gaps or insufficient funds may lead to a decrease in the number of transactions.
- On the same day, multiple signals are attempted in sequence according to the order of the targets within the combination.
- The markers at the top may take precedence in using the available funds.
- Subsequent bids may be skipped due to insufficient funds or criteria.
- Simulated trades still cannot replicate true liquidity and order books.
Chat2Invest AI investment assistant
Chat2Invest uses natural language to invoke tools for analyzing stocks, markets, portfolios, and strategies. It is better suited for retrieving data, explaining rules, and reviewing past performance, rather than predicting which stock will rise next.
- Analysis of the technical, fundamental, and news aspects of a single stock.
- Batch comparison of multiple stocks or ETFs.
- Market overview and target search.
- Analysis of the risks, portfolio composition, and performance of simulated portfolios.
- Explanation of the reasons behind the trigger of strategic signals.
- Research on primitive strategy configuration and review of parameters.
- Charts and price trend displays.
- Clues for improving strategies and risk warnings.
How to ask questions to an AI assistant
- First, clarify the market, the target, and the time frame.
- Ask a question that can be verified; don’t just ask whether it’s possible to buy it.
- It is required to list the data used, the metrics, and the assumptions underlying the strategy.
- Enable AI to distinguish between facts, calculation results, and explanatory inferences.
- When comparing multiple targets, maintain the same time period and metrics.
- An explanation of drawdowns, volatility, and failure scenarios is required.
- Return to the charts, combinations, and original data to verify the answers.
- The final decision should take into account one’s own account, goals, and financial capacity.
What AI assistants cannot do
- It guarantees an increase in the value of a particular stock or cryptocurrency.
- Accurately predict future market trends.
- Make buying and selling decisions on behalf of the user.
- Understand the user’s complete financial situation and legal obligations.
- Ensure that the data, news, and model explanations are error-free.
- Eliminate overfitting, survivorship bias, and lookahead bias.
- Provide personalized advice in place of licensed investment advisors.
Signal Insights and Advanced Analytics
- Data health check: Validates fields, time ranges, and record integrity.
- Signal validity: Check the buy/sell signals and their subsequent performance.
- Signal switching: Identify transitions that do not conform to the state machine logic.
- Transaction frequency: Identifying excessive activity and cost risks.
- Volatility analysis: Assess the risks associated with assets that exhibit high volatility and leverage.
- Risk signals: Abnormal drawdowns and concentrated exposure.
- SQLite download: Use it locally to examine strategy signal data with SQL.
- Datasette query: Perform custom data checks in the browser.
Agent Lab
Agent Lab allows members to connect their own agents such as Codex, Claude Code, and OpenCode to the guidance research interface. The agents are responsible for organizing questions and selecting configurations, while the guidance system is in charge of verifying, parsing, executing, and saving individual experiments.
| Tools | Function | Can’t do anything. |
|---|---|---|
| resolve_symbols | Parse the input target into platform-standard code. | No combination will be created. |
| validate_strategy_config | Verification policy configuration and current contract | It will not automatically fix all logic issues. |
| create_lab_run | Create a one-time test experiment | Will not subscribe or place an order. |
| get_lab_run | Read the experiment status and results | The official combination will not be modified. |
Agent Lab security rules
- A valid regular or lifetime membership is required.
- A temporary session token is valid for approximately 12 hours by default.
- A single member can have only one active session at a time.
- The plaintext token is displayed only once; it cannot be restored after refreshing.
- Tokens can be actively revoked on a web page.
- There are no long-term interface keys or refresh tokens.
- The links to the experimental results are not part of the public index; however, those who know the links can access the content that is permitted to be made public.
- Do not place tokens or result links in public repositories, chats, or screenshots.
- Experiments do not automatically become official combinations.
- Agents cannot execute any code on the platform.
Member price
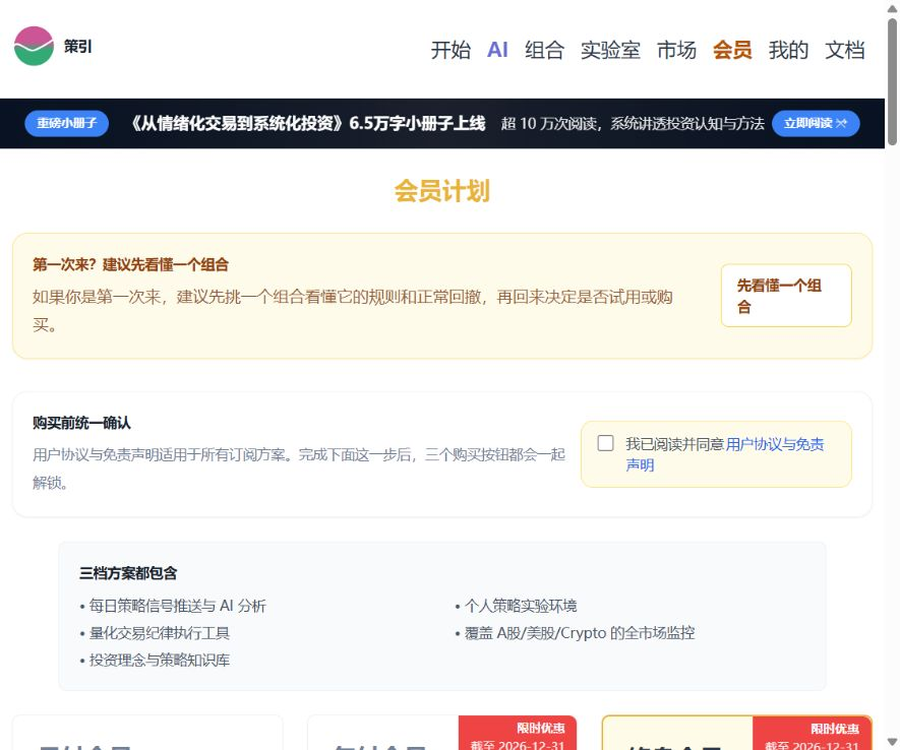
The following are the prices in US dollars as displayed on the official pricing page at the time of verification in August 2026; the discount rates are valid until December 31, 2026. All three tiers offer the same core functions, with the differences lying mainly in the duration and the lifetime benefits provided.
| Plan | Price | Suitable for users | Main differences |
|---|---|---|---|
| Monthly membership | $ | First, observe 1 to 2 combinations. | Using it on a monthly basis helps to reduce long-term commitments. |
| Annual membership | $ | The approval rules are tracked and prepared for long-term use. | The original price was $120; the page states that it is 27% cheaper than the monthly payment option. |
| Lifetime member | $ | Commit to long-term use and be willing to support the project. | Original price: $600, with permanent updates and priority support. |
Three tiers of shared benefits
- Daily strategic signal delivery and AI analysis.
- Personal strategy experimentation environment.
- Tools for enforcing quantitative trading discipline.
- Monitoring of the A-share market, U.S. stock market, and cryptocurrency market.
- Knowledge base on investment concepts and strategies.
- Chat2Invest interactive analysis.
- Customize simulation combinations and policy parameters.
- Review of combined risk and return.
- Custom signal email notifications.
- Member knowledge community.
How to choose a membership
| Situation | Suggestions | Reason |
|---|---|---|
| First time using | Try it first or opt for a monthly payment. | Verify data, signals, and review rhythm |
| Ongoing observation over several months | Annual payment | The current price is lower than the total cost of monthly payments over 12 months. |
| Determine long-term use | Re-evaluate throughout life | It is necessary to take into account the ongoing operation of the product and the opportunity cost. |
| Just looking for assets that are bound to rise tomorrow. | It is not recommended to purchase. | The platform clearly does not recommend any stocks nor provide any forecasts. |
| Long-term drawdowns are unacceptable. | It is not recommended to purchase. | Strategy research cannot eliminate market losses. |
Trial and discounts
- Submit an application for a trial on the homepage; once approved, you will be granted a one-month trial period.
- By completing the “Intuition and Systems” mini-game and sharing a screenshot, you can apply for a one-month membership according to the instructions on the page.
- The i365 lifetime membership page states that it is possible to purchase the associated benefits at half of the original price.
- The eligibility for discounts, the methods of redemption, and their validity period are subject to the information displayed on the relevant page and to the confirmation provided by customer service.
- Do not skip understanding the product and its risks just to get a discount.
Payments and Refunds
The order is processed by Lemon Squeezy as the nominal merchant, and this name will also appear on the invoice. The user agreement states that digital services are delivered immediately; in principle, no refunds are provided, unless required by law or explicitly approved by the payment provider.
- Confirm the package, duration, currency, and taxes before making the payment.
- For annual and lifetime plans, the deadline for the discount must be confirmed.
- Save order emails, bills, and benefit pages.
- Refunds and disputes are handled in accordance with the payment provider’s policies.
- Apply for a trial or a monthly subscription evaluation first to reduce the risk of non-refundable payments.
- Lifelong benefits remain dependent on the continuous operation of the product and its terms.
Data source and timeliness
The user agreement states that the market data comes from authorized third-party suppliers and public information sources, and is provided as it is. The platform does not guarantee that the data is accurate, complete, or up-to-date; important figures should be verified against those provided by exchanges, brokers, and official disclosures.
- Check the market date, time zone, and trading day.
- Verify whether the closing price has been adjusted.
- Verify the handling of stock splits, dividends, and suspensions.
- Check the exchanges that offer encrypted assets and the currencies in which they are quoted.
- The fundamental data requires confirmation of the financial reporting period and the update date.
- News and AI summaries require verification against the original reports.
- Signal delay may change the actual execution price.
Differences between backtesting and live trading
| Differences | Backtesting simulation | Real transactions |
|---|---|---|
| Deal closed | Simulation based on rules and historical prices | There may be waiting in line, orders rejected, or failed transactions. |
| Slippage | It can only be approximated or simplified. | Affected by volatility, order volume, and liquidity |
| Costs | Simplified assumptions may be adopted. | Commissions, taxes, and spreads are actually incurred. |
| Data | Historical data may have been cleaned. | Real-time data may be delayed or corrected. |
| Psychology | There is no real pressure related to profits and losses. | Pullbacks can affect execution discipline. |
| Policy modification | Repeated trials are possible. | Temporarily changing the rules will deviate from the original simulation. |
| Capacity | Large-scale shocks are generally not taken into account. | The size of the funding amount affects the transaction price. |
Common backtesting biases
- Overfitting: Adjust the parameters repeatedly until the best historical performance is achieved.
- Forward-looking bias: Using information that was not known at the time.
- Survivorship bias: Only those entities that still exist at the present time are retained.
- Data mining bias: Testing a large number of strategies shows only the winners.
- Underestimation of costs: Ignoring commissions, taxes, spreads, and shocks.
- Overestimation of liquidity: Assuming that transactions can always be completed at the target price.
- Error in restoring rights: Inconsistent handling of stock splits and dividends.
- Time mismatch: Confusion between the timing of indicator calculation and the actual time when trading is possible.
Which users are it suitable for
- Individual investors who wish to reduce emotional decision-making.
- Users who are willing to understand the strategy rules, drawbacks, and ways in which failures can occur.
- Those without programming experience but who wish to develop a transparent technology strategy.
- Researchers who need simulated portfolios for A-share stocks, U.S. stocks, and cryptocurrency assets.
- Users who want to use AI to analyze data rather than having AI recommend stocks directly.
- Members who wish to conduct structured strategy experiments using their own coding agents.
- Learners interested in systematic investing, quantitative backtesting, and strategy review.
Which users are not suitable for it
- Those who are in search of stocks that are bound to rise in value in the short term and of guaranteed returns.
- Those who focus only on the return rate, without considering the maximum drawdown and the time it takes to recover.
- Those who hope that the platform will automatically connect to the account and carry out transactions.
- Those who are unable to verify data independently and assume investment risks.
- Those who need a licensed advisor to create a personalized asset allocation plan.
- Those who wish to change the rules frequently without maintaining the ability to review them.
- Newcomers who consider leveraged ETFs or crypto assets to be low-risk products.
Product advantages
- Starting from rules, backtesting, and post-mortems, a more restrained approach is adopted.
- It covers the A-share market, the U.S. stock market, and the cryptocurrency market.
- Primitive strategies can be combined without programming.
- Trading strategies and funding strategies are clearly separated.
- Public combinations facilitate learning first and then creating custom experiments.
- Chat2Invest combines natural language with structured tools.
- Signal Insights supports data verification at the SQL level.
- Agent Lab uses short-term tokens and restricted tools to reduce the risk of arbitrary execution.
- The document provides a detailed explanation of backtesting, funding, and execution mechanisms.
- It is clearly stated that no stock recommendations are given, no transactions are carried out, and no guarantees regarding returns are provided.
Usage restrictions and precautions
- The platform is operated by individual developers, and its usability and support capabilities need to be assessed.
- All combinations are the results of historical backtesting and simulations.
- Market data may be delayed, inaccurate, or incomplete.
- AI analysis may misinterpret data or produce incorrect interpretations.
- Primitive systems are currently unable to express all complex investment strategies.
- Buy/sell signals are not equivalent to actual transactions or investment advice.
- Leveraged products and crypto assets can suffer extreme losses.
- The fair use policy restricts automated scraping and abnormal AI calls.
- Digital services are, in principle, non-refundable once sold.
- The benefits of lifetime membership depend on the continuous operation of the service.
- The platform does not make the complete source code of its production system available to the public.
- Users must comply with the financial and data regulations in their respective regions.
Fair Use Policy
- Repeated requests in large quantities over a short period of time are prohibited.
- Calls that clearly exceed an individual’s research needs are prohibited.
- The use of automated tools for bulk data extraction is prohibited.
- Reselling or sharing the service with third parties is prohibited.
- Abnormal accounts may have their frequency of use or spending limits set.
- Severe violations may result in the suspension or termination of services.
- When batch research is required, it is necessary to first consult the platform to determine the appropriate approach.
GitHub and the open-source status
The official GitHub repository of MyInvestPilot makes available the earlier open-source version Invest Alchemy, as well as details on its architecture and other relevant information; however, the source code for the current production platform is not made public. The description section should state that \"the commercial platform is not open-source, but information on the early projects and their architecture is available.\"
| Project | Public status | License or instructions |
|---|---|---|
| Production platform guidance | The complete source code is not publicly available. | Paid commercial services |
| invest-alchemy | The early open-source precursor code was made public. | No clear license was found in the warehouse; it should not be assumed that it can be used for commercial purposes freely. |
| ai-architecture | Architecture articles made public | MIT License |
| Primitive Schema and AI reference documents | Publicly readable | Used to configure checksum and Agent assistance. |
| Agent Lab | Member-restricted interfaces | It’s not any arbitrary code or public experimental platform. |
Invest Alchemy and current strategies
| Comparison items | Invest Alchemy | Current policy guidance |
|---|---|---|
| Positioning | Early version of the ETF trading assistant project | Systematic investment analysis and strategy research platform |
| Market | The focus is on ETFs. | A-share market, U.S. stock market, and cryptocurrency market |
| Strategy | Fixed strategies and combinations in the code | Built-in policies, primitive DSL, and Agent experiments |
| AI | Limited capabilities in the early stages | Chat2Invest and AI review |
| Form | Public code repository | Paid online services |
| Can it be considered equivalent? | No. | The production system has evolved significantly. |
Basic information
| field | Content |
|---|---|
| Tool name | Guide |
| English name | MyInvestPilot |
| Operation mode | Operated by independent developers |
| Tool type | Systematic investment analysis, strategy backtesting, and simulated portfolios |
| Support the market | A-share market, U.S. stock market, crypto assets |
| Coverage scale | Over 17,000 stocks and ETFs |
| Monthly payment | 9.99 dollars |
| Annual payment | $ |
| for life | $ |
| Whether to execute the transaction | No |
| Whether investment advice is provided | No |
| Is login required? | Member features require login using an email verification code. |
| Are development interfaces available? | Agent Lab provides temporary research sessions for active members. |
| Is it open source? | The current platform is not open-source; the early versions and its architecture are public. |
Recommendation score
4.4 / 5. CeYin integrates backtesting, simulated portfolios, primitive strategies, AI-based analysis, and Agent research in a fairly comprehensive manner, and it also provides clear explanations regarding risk boundaries; however, it remains a paid tool developed by an individual, and its data, models, backtesting results, and ongoing operations cannot replace independent verification.
Frequently Asked Questions
Will the strategy bot trade for me automatically?
No. The platform is not connected to brokers nor does it execute actual orders; all trading signals and portfolio transactions are the result of technical rules and simulated calculations.
Does the recommendation service suggest stocks that are bound to rise in value?
No. The authorities explicitly refuse to recommend specific stocks, predict market trends, or guarantee any returns; AI is used solely for data retrieval, the explanation of strategies, and post-analysis.
How much does it cost to recruit members?
The page for August 2026 shows a monthly fee of $9.99, an annual fee of $88, and a one-time fee of $499 for lifetime access; the annual and lifetime discounts are valid until December 31, 2026.
Are annual and lifetime memberships more cost-effective?
Based solely on the current pricing, the cost per unit of time appears to be lower, but factors such as non-refundable fees, the ongoing operation of the product, and the actual frequency of use also need to be taken into account. New users would do well to try it out first or opt for a monthly payment plan.
Is the return from backtesting reliable?
Backtesting can be used to understand historical behavior and risks, but it is not a guarantee of future returns. Data discrepancies, overfitting, costs, slippage, and liquidity can all lead to results that differ from the actual ones.
Which investment targets are supported?
It currently covers A-share stocks, U.S. stocks, and crypto assets, with over 17,000 stocks and ETFs available. The specific instruments, time range of the data, and data quality need to be verified on the platform.
Is it possible to create strategies without any programming experience?
Yes. The primitive system offers a modular configuration approach, but users still need to understand indicators, signals, funding rules, and backtesting risks.
Can Agent Lab run its own Python strategies?
No. It only accepts supported built-in configurations or policy DSLs, and it allows for creating one-time experiments using four limited tools.
Promote open source?
The current production platform does not have its complete source code made available publicly. The original code from Invest Alchemy and the architectural documentation under the MIT license are available, but they cannot be considered equivalent to the current commercial services.
Tools similar to those used for guiding




 Guigong Network Security Registration No. 45132202000164