






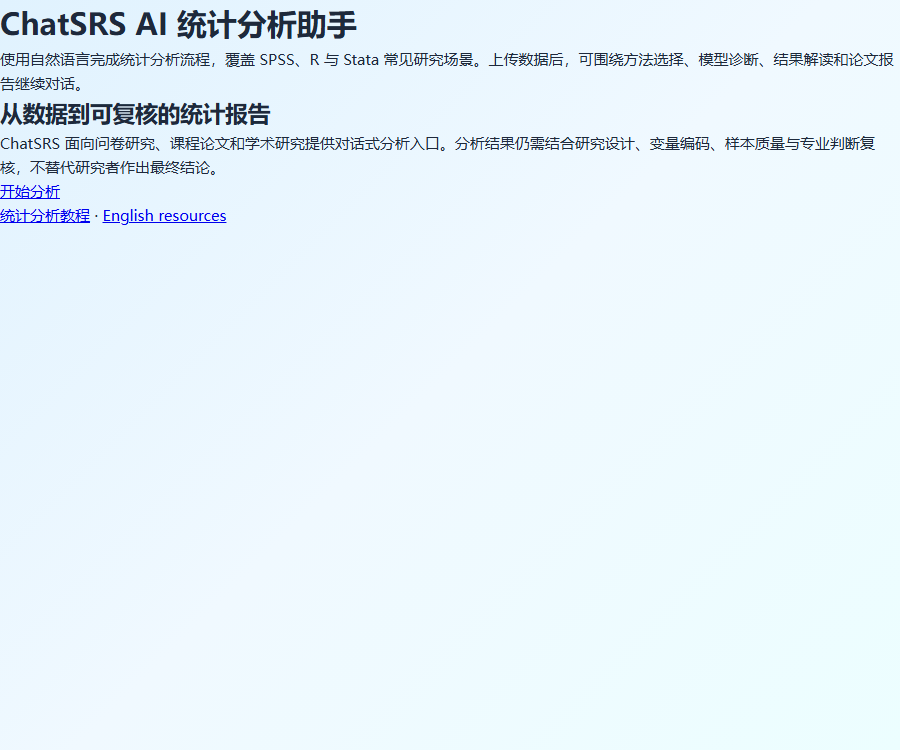
ChatSRS AI Statistical Assistant
AI-based conversational statistical analysis tool; no need to install SPSS
Tags:AI table data processingWhat is ChatSRS?
ChatSRS is a conversational AI statistical analysis tool operated by Chengdu Natural Intelligence Group Technology Co., Ltd.
After the user uploads data and specifies the research question, the system will propose an analysis plan; once this is approved, the analysis is carried out and the results are generated.
Its relationship with SPSS, Stata, and R
ChatSRS incorporates common statistical tasks into the dialogue interface, but it is not an official IBM SPSS product or a software download site.
- It can read SPSS data files and perform various common statistical analyses.
- It supports Stata data as well as various analysis processes such as panel and econometric analyses.
- The underlying statistical methods correspond to multi-class models in the R language ecosystem.
- Users do not need to first learn complex menus or the full programming syntax.
- The default parameters may vary among different software programs, and the key results should be verified cross-checkingly.
Overview of core functions
| Functions | Key capabilities | Common outputs |
|---|---|---|
| Data import | Reading data from tables and statistical software | Variables and data structures |
| Method recommendations | Propose an analysis plan based on the questions and variables. | Steps and applicable conditions |
| Automatic analysis | Run statistical calculations after confirming the plan. | Statistics and test results |
| three-line table | Organize the result tables suitable for use in papers. | Editable table |
| Chart generation | Generate statistical charts using the specified method. | Bar charts, ROC, etc. |
| Interpretation of results | Explain statistical measures and their research implications | Text description |
| Document export | Save the analysis tables and textual results | Word, PDF, or Excel |
Supported data files
The current interface supports a variety of common data formats; the actual structure and size constraints are subject to those specified on the upload page.
| Format | Typical files | Usage suggestions |
|---|---|---|
| Excel | XLSX or XLS format | The first line contains the clear variable name. |
| CSV | Comma-separated text | Check the encoding and delimiters. |
| SPSS | SAV data | Retain variable labels and value labels |
| Stata | DTA data | Check the version and variable type. |
| R data | The R format listed in the Chinese entry column | It is subject to the capabilities of the current upload box. |
- Each column should correspond to a clearly defined variable.
- Categorical variables should have clear and consistent coding.
- Missing values, outliers, and reverse-scored items need to be explained in advance.
- A variable dictionary should be created and a copy of the original data should be retained before analysis.
Questionnaire and scale analysis
- Descriptive statistics: sample size, mean, standard deviation, median, and distribution.
- Frequency analysis: Calculates the frequency and percentage of categorical variables.
- Cross-analysis: Compares the distribution and associations among different groups.
- Reliability analysis: Assesses the internal consistency of the scale.
- Validity analysis: Examine the structure of the scale using methods such as factor analysis.
- Correlation analysis: Estimates the direction and strength of the relationship between variables.
- Regression analysis: Estimating the relationship while controlling for other variables.
- Mediation and moderation: Testing mechanisms and conditional relationships.
The quality of a questionnaire cannot be assessed solely based on statistical indicators; sampling, the design of questions, and the data collection process are equally important.
Common basic statistical methods
| Methods | Typical uses | It needs to be checked. |
|---|---|---|
| One-sample t-test | Comparison of mean value with target value | Independence and distribution |
| Independent samples t-test | Compare two independent groups | Normality and variance |
| Paired t-test | Compare the changes in the same object before and after. | Pairwise difference distribution |
| One-way ANOVA | Compare the means of three or more groups | Homogeneity of variance and post-hoc tests |
| Repeated Measures ANOVA | Multiple time points or conditions | Spherical assumption and absence |
| Chi-square test | Analyzing the association of categorical variables | Expected frequency |
| Non-parametric tests | Process data that does not meet the parameter assumptions. | Rank sum and distribution shape |
Regression, Factor Analysis, and Clustering
- Linear regression: Analyzes the relationship between a continuous dependent variable and predictive variables.
- Logistic regression: Analyzes binary classification results and odds ratios.
- Ordered Logistic: Used to handle outcome variables that have a hierarchical order.
- Multiple Logistic: Handles the results of multiple unordered categories.
- Exploratory factor analysis: to identify the possible underlying structure of the scale.
- Confirmatory factor analysis: Tests the predefined measurement model.
- Principal Component Analysis: Reduces dimensionality while preserving information.
- Cluster analysis: Divides samples into different groups based on their characteristics.
The choice of model should be determined by the research design and the nature of the variables, rather than being based solely on repeated attempts to achieve significance.
Advanced Statistics and Empirical Analysis
| Methods | Common scenarios | Key risks |
|---|---|---|
| Structural Equation Modeling | Relationship between measurement model and path | Sample size, fitting, and model identification |
| Panel regression | Data on individuals and time dimensions | Fixed effects, correlations, and standard errors |
| DID | Assessment of the impact of policies or events | Parallel trends and concurrent shocks |
| PSM | Inter-group matching based on observable features | Common support and unobserved confounding |
| Instrumental variable | Addressing some endogenous problems | Correlation, exclusion constraints, and weak tools |
| Survival analysis | Time-to-event data | Censoring and proportional hazards assumption |
| ROC | Assessing classification or diagnostic capabilities | Thresholds, samples, and external validation |
| GEE | Related or duplicate observation data | Related structures and robust standard errors |
Three-line tables, charts, and interpretation of results
After completing the analysis, ChatSRS can generate tables, graphs, and editable text descriptions.
- A three-line table is used to present statistics, coefficients, and significance in a consolidated format.
- The textual interpretation will explain statistical indicators and their common research meanings.
- Charts can be used to show distributions, differences between groups, regression, or ROC results.
- After exporting, the format still needs to be adjusted according to the school’s or journal’s template.
- The results section should distinguish between statistical associations, effect sizes, and causal conclusions.
- An AI explanation cannot be regarded as the final version of a paper that requires no verification.
ChatSRS Usage Guide
- Organize and back up the original data, and create explanations for variable names and codes.
- Remove unnecessary direct identifiers such as names, ID numbers, and phone numbers.
- Log in to the website and upload Excel, CSV, SAV, or DTA files.
- Explain the research background, dependent variable, independent variable, grouping, and research question.
- Let the AI first come up with an analysis plan, the methodological requirements, and a check of the necessary data.
- Check the variable types, missing values, anomalies, and model assumptions one by one.
- Run the analysis after confirming the plan; do not skip all checks at once.
- Read three-line tables, charts, statistics, and textual explanations.
- Use a second software or perform manual calculations to verify the key results.
- Export in Word, PDF, or Excel and make the necessary revisions in accordance with the paper’s requirements.
Comparison of package prices
As of August 30, 2026, the English version of ChatSRS’s product page lists the following prices in US dollars.
| Plan | Price | Validity period and frequency | Primary interests |
|---|---|---|---|
| Free version | $ | The account page shows the current credit limit. | Method recommendations, analysis, and tables |
| Rika | $ | 24 hours, 30 times every 5 hours | Export to Excel and Word |
| Weekly card | $ | 7 days, 30 times every 5 hours | Export to Excel and Word |
| Monthly card | $ | 30 days, 30 times every 5 hours | Export and priority support |
The free quota, number of times, file size, and reset time may vary; the details are specified on the plan page associated with the account.
The package is prepaid; in principle, no refunds are provided for virtual services once purchased. It is necessary to review all the relevant rules before making the payment.
Data privacy and data masking
The platform uses HTTPS for data transmission; the uploaded data, conversations, and results are not used to train large language models.
- The service may handle accounts, data uploads, conversations, and necessary logs.
- Statistical tasks may pass the necessary information to relevant third-party services for processing.
- Before uploading, remove the name, phone number, ID number, and exact address.
- Medical data must also comply with ethical approval procedures and institutional data regulations.
- Commercial data must meet requirements regarding contracts, confidentiality, and cross-border processing.
- Users can request access to, modify, or delete accounts, sessions, and files.
Transmission encryption does not mean zero risk for the data; sensitive projects require a security assessment at the organizational level.
API, SDK, and open-source status
As of the verification date, ChatSRS does not provide public developer API documentation, an API Key console, or an official SDK.
Nor was any official open-source code repository that could be attributed to that product or operating company found.
- The automatic web page analysis feature is not equivalent to providing an API to external parties.
- The user agreement prohibits crawlers, automated bulk requests, and bypassing of restrictions.
- For institutional data pipelines or system integrations, please contact the authorities for confirmation.
Which users are it suitable for
- Students and postgraduates: dealing with the statistical aspects of courses and degree theses.
- Social science researchers: Complete questionnaires, scales, as well as correlation and regression analyses.
- Medical researchers: comparison between auxiliary groups, survival analysis, and ROC.
- Business and economics researchers: Handling panel data, DID, PSM, and instrumental variables.
- Market researchers: Analyze consumer questionnaires and segmentation data.
- Statistics beginners: Understanding methods and outputs through dialogue.
- Supervisor and reviewers: Review the analytical approach and the presentation of results.
Result review and method boundaries
- The methods of AI-based recommendation may not correspond to actual research designs.
- An error in variable coding can render the entire set of statistical results invalid.
- Missing values, outliers, and multiple comparisons must be addressed explicitly.
- Significant does not equate to important; both the effect size and the confidence interval should be reported.
- Observational data usually cannot directly establish a causal relationship.
- High-risk medical and policy conclusions should be reviewed by qualified statisticians.
- The final paper is the responsibility of the author; tools cannot replace professional judgment.
Frequently Asked Questions
Is ChatSRS the official website of SPSS?
No, it is an independent browser analytics tool that can read SAV data; it has no connection to IBM.
What data formats does ChatSRS support?
Currently, the main supported formats are Excel, CSV, SPSS SAV, and Stata DTA.
Can ChatSRS automatically select statistical methods?
Proposals can be submitted along with explanations for them, but the user must verify the research design, variables, and model assumptions.
Is there a free quota for ChatSRS?
After registration, you can use the free quota; the actual number of uses and the reset time are specified on the account plan page.
How much is the monthly ChatSRS subscription?
The official website indicates that the monthly subscription costs $39.90, is valid for 30 days, and allows 30 runs every 5 hours.
Does ChatSRS provide an API?
The official website does not yet provide access to developer APIs, an API Key console, or official SDKs.
Is ChatSRS an open-source tool?
No verifiable official open-source repository has been found, and the web service does not imply that the product’s source code is available publicly.
Tools similar to the ChatSRS AI statistical assistant





 Guigong Network Security Registration No. 45132202000164